

Note
Go to the end to download the full example code or to run this example in your browser via Binder.
Robust Statistics with Histograms and T-Digest#
The mean of a bin is sensitive to outliers and hides the shape of skewed
distributions. pyinterp.Histogram2D keeps, in each bin, a compact
summary of the whole distribution built with the T-Digest algorithm, and
pyinterp.TDigest does the same for a 1D stream of values. In this
example, you will learn how to map per-bin medians and quantiles, how to merge
digests computed on separate batches, and how the compression parameter trades
accuracy for memory.
import pickle

import matplotlib.pyplot
import numpy

import pyinterp
import pyinterp.tests

rng = numpy.random.default_rng(0)
Contaminated Drifter Speeds#
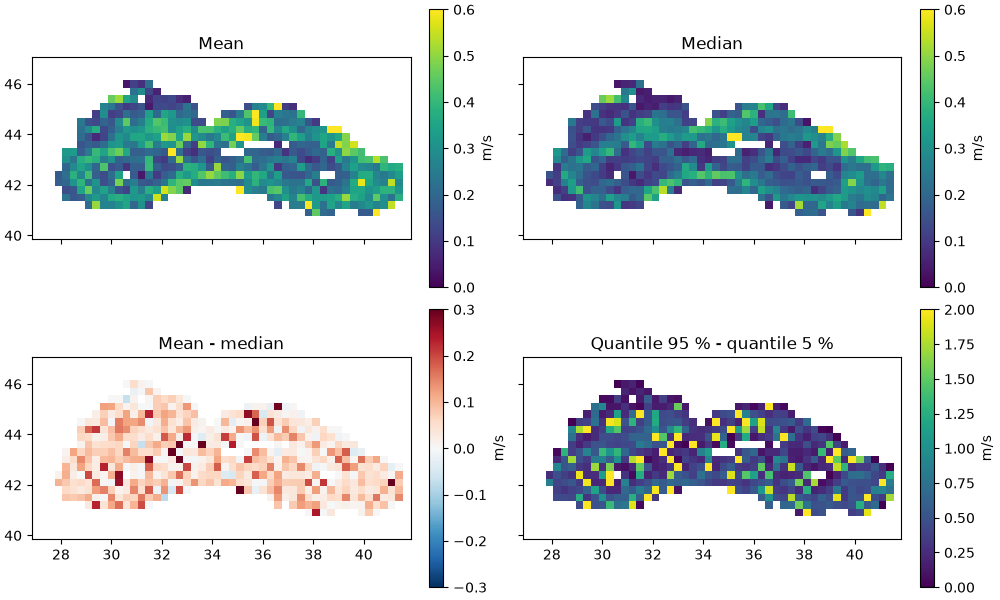
We reuse the drifter velocities of the Black Sea, already binned in the Binning example, and compute their speed. To mimic spurious positioning fixes, 3 % of the speeds are replaced by values between 1 and 3 m/s, well above the typical speed of the currents.
ds = pyinterp.tests.load_aoml()
lon = ds.lon.values
lat = ds.lat.values
speed = numpy.hypot(ds.ud.values, ds.vd.values)

outliers = rng.random(speed.size) < 0.03
noisy = speed.copy()
noisy[outliers] = rng.uniform(1.0, 3.0, outliers.sum())
Per-Bin Distributions#
A pyinterp.Histogram2D is defined by two axes, like
pyinterp.Binning2D. Each value pushed is assigned to the bin of the
nearest grid node, and NaN values are ignored. Besides the
mean, the
quantile method estimates any
quantile of the values in each bin. Empty bins are set to NaN.
x_axis = pyinterp.Axis(numpy.arange(27, 42, 0.3), period=360.0)
y_axis = pyinterp.Axis(numpy.arange(40, 47, 0.3))

hist = pyinterp.Histogram2D(x_axis, y_axis)
hist.push(lon, lat, noisy)

mean = hist.mean()
median = hist.quantile(0.5)
q05 = hist.quantile(0.05)
q95 = hist.quantile(0.95)
The same histogram built from the clean speeds gives the reference against which we measure the bias introduced by the outliers.
reference = pyinterp.Histogram2D(x_axis, y_axis)
reference.push(lon, lat, speed)
ref_median = reference.quantile(0.5)

print(f'Mean absolute bias of the mean:   '
      f'{numpy.nanmean(numpy.abs(mean - ref_median)):.3f} m/s')
print(f'Mean absolute bias of the median: '
      f'{numpy.nanmean(numpy.abs(median - ref_median)):.3f} m/s')
Mean absolute bias of the mean:   0.077 m/s
Mean absolute bias of the median: 0.008 m/s
The mean is pulled up wherever an outlier falls in a bin, whereas the median barely moves. The spread between the 5 % and 95 % quantiles shows where the distribution is wide, either because the currents are variable or because the bin holds a few outliers.
mx, my = numpy.meshgrid(x_axis, y_axis, indexing='ij')
fig, axes = matplotlib.pyplot.subplots(2,
                                       2,
                                       figsize=(10, 6),
                                       layout='constrained',
                                       sharex=True,
                                       sharey=True)
panels = [
    (mean, 'Mean', 'viridis', 0, 0.6),
    (median, 'Median', 'viridis', 0, 0.6),
    (mean - median, 'Mean - median', 'RdBu_r', -0.3, 0.3),
    (q95 - q05, 'Quantile 95 % - quantile 5 %', 'viridis', 0, 2),
]
for ax, (field, title, cmap, vmin, vmax) in zip(axes.flat, panels):
    pcm = ax.pcolormesh(mx,
                        my,
                        field,
                        cmap=cmap,
                        vmin=vmin,
                        vmax=vmax,
                        shading='auto')
    ax.set_title(title)
    ax.set_aspect('equal')
    fig.colorbar(pcm, ax=ax, label='m/s')
Streaming Quantiles#
pyinterp.TDigest summarizes a stream of values. Here, the stream is
a heavy-tailed log-normal sample that arrives in two batches. Each batch is
reduced to a digest, and the two digests are merged with +=, as you would
do with partial results computed by different workers. The merged digest is
compared with numpy.quantile() computed on the whole sample.
stream = rng.lognormal(mean=0.0, sigma=1.0, size=200_000)
first, second = numpy.split(stream, 2)

digest = pyinterp.TDigest(first)
digest += pyinterp.TDigest(second)

probabilities = numpy.array([0.01, 0.05, 0.25, 0.5, 0.75, 0.95, 0.99])
estimated = digest.quantile(probabilities)
exact = numpy.quantile(stream, probabilities)
relative_error = numpy.abs(estimated / exact - 1)

print(f'Values summarized: {digest.count()}')
for p, est, ref, err in zip(probabilities, estimated, exact, relative_error):
    print(f'  q{p:<5.2f} T-Digest={est:8.4f} numpy={ref:8.4f} '
          f'error={err:.2%}')
Values summarized: 200000
  q0.01  T-Digest=  0.0974 numpy=  0.0968 error=0.62%
  q0.05  T-Digest=  0.1925 numpy=  0.1927 error=0.11%
  q0.25  T-Digest=  0.5092 numpy=  0.5084 error=0.15%
  q0.50  T-Digest=  1.0002 numpy=  1.0000 error=0.02%
  q0.75  T-Digest=  1.9685 numpy=  1.9653 error=0.16%
  q0.95  T-Digest=  5.2282 numpy=  5.1759 error=1.01%
  q0.99  T-Digest= 10.4894 numpy= 10.3521 error=1.33%
Compression versus Accuracy#
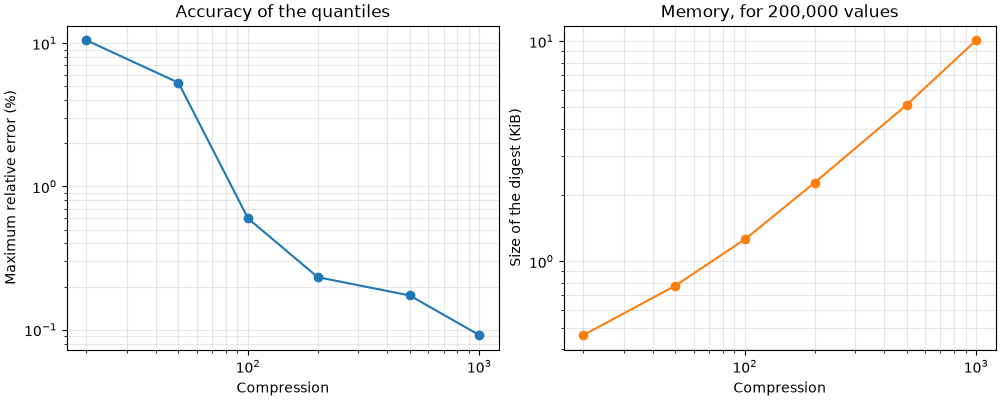
The compression parameter (100 by default) bounds the number of centroids
kept by the digest: its size no longer depends on the number of values, only
on the compression. Higher values give more accurate quantiles, especially in
the tails, at the cost of memory. We measure the size of the digest by its
pickled state. The same parameter is accepted by
pyinterp.Histogram2D, where it applies to every bin.
compressions = numpy.array([20, 50, 100, 200, 500, 1000])
max_error = []
size_kib = []
for compression in compressions:
    item = pyinterp.TDigest(stream, compression=int(compression))
    max_error.append(
        numpy.abs(item.quantile(probabilities) / exact - 1).max())
    size_kib.append(len(pickle.dumps(item)) / 1024)

fig, (ax1, ax2) = matplotlib.pyplot.subplots(1,
                                             2,
                                             figsize=(10, 4),
                                             layout='constrained')
ax1.loglog(compressions, numpy.array(max_error) * 100, 'o-')
ax1.set_xlabel('Compression')
ax1.set_ylabel('Maximum relative error (%)')
ax1.set_title('Accuracy of the quantiles')
ax1.grid(True, which='both', alpha=0.3)
ax2.loglog(compressions, size_kib, 'o-', color='tab:orange')
ax2.set_xlabel('Compression')
ax2.set_ylabel('Size of the digest (KiB)')
ax2.set_title(f'Memory, for {stream.size:,} values')
ax2.grid(True, which='both', alpha=0.3)
Total running time of the script: (0 minutes 1.442 seconds)
