

Note
Go to the end to download the full example code or to run this example in your browser via Binder.
Statistics on Chunked Data with Dask#
When a dataset no longer fits in memory, the statistics containers of pyinterp
can still be used: the pyinterp.dask helpers process each chunk of a
Dask array independently and merge the partial
results into a single container. In this example, you will learn how to
compute descriptive statistics, quantiles, binned statistics and histograms on
chunked arrays, and check that the result matches the in-memory computation.
import dask
import dask.array
import matplotlib.pyplot
import numpy

import pyinterp
import pyinterp.dask
How It Works#
Every helper follows the same map then merge pattern:
dask.array.map_blocks()builds, for each chunk, a fresh container (e.g. apyinterp.Binning2D) and feeds it the values of that chunk only. The chunks are processed in parallel by the Dask scheduler.The partial containers are gathered and combined with the
+=operator, which merges counts, moments, extrema and T-Digest centroids exactly as if all the values had been pushed into a single container.
Only one container per chunk is kept in memory, never the full dataset. Here we use the threaded scheduler so the example runs locally, without a distributed cluster.
dask.config.set(scheduler="threads")
<dask.config.set object at 0x7089256e6850>
Building Chunked Arrays#
We generate two million scattered observations of a smooth global field
plus some noise. In a real application the arrays would come from files
opened lazily (e.g. with xarray.open_mfdataset() or
dask.array.from_zarr()); here we wrap NumPy arrays with
dask.array.from_array() and split them into chunks of 250,000 points.
rng = numpy.random.default_rng(0)
size = 2_000_000
lon = rng.uniform(-180.0, 180.0, size)
lat = rng.uniform(-80.0, 80.0, size)
field = numpy.cos(numpy.radians(lat)) * numpy.sin(2 * numpy.radians(lon))
values = field + rng.normal(0.0, 0.3, size)

chunks = 250_000
x = dask.array.from_array(lon, chunks=chunks)
y = dask.array.from_array(lat, chunks=chunks)
z = dask.array.from_array(values, chunks=chunks)
print(f"{z.npartitions} chunks of {chunks:,} points")
8 chunks of 250,000 points
Descriptive Statistics#
pyinterp.dask.descriptive_statistics() returns the same object as
pyinterp.DescriptiveStatistics. Mean, variance, skewness and
kurtosis are merged with numerically stable formulas, so the result agrees
with the in-memory computation to rounding error.
stats = pyinterp.dask.descriptive_statistics(z)
eager = pyinterp.DescriptiveStatistics(values)
print(f"count={stats.count()}, mean={stats.mean():.6f}, "
      f"std={numpy.sqrt(stats.variance()):.6f}")
for name in ("mean", "variance", "skewness", "kurtosis", "min", "max"):
    numpy.testing.assert_allclose(getattr(stats, name)(),
                                  getattr(eager, name)(),
                                  rtol=1e-10)
count=2000000, mean=0.000097, std=0.609060
Quantiles#
pyinterp.dask.tdigest() builds one pyinterp.TDigest per chunk
and merges their centroids. The T-Digest is an approximation, so the
quantiles are compared with numpy.quantile() using a tolerance rather
than an exact equality.
Quantiles: -1.2949 -0.4519 -0.0001 +0.4524 +1.2959
Max abs. difference vs numpy: 1.6e-03
Binned Statistics#
pyinterp.dask.binning2d() takes a pyinterp.Binning2D that
only describes the grid: it is copied internally and left empty. The
returned instance holds the statistics accumulated over all the chunks.
The simple keyword selects nearest-bin (True) or linear binning.
binning = pyinterp.Binning2D(
    pyinterp.Axis(numpy.arange(-180.0, 180.0, 5.0), period=360.0),
    pyinterp.Axis(numpy.arange(-80.0, 80.1, 5.0)),
)
binned = pyinterp.dask.binning2d(x, y, z, binning, simple=True)
print(f"Template still empty: {binning.count().sum() == 0}")
Template still empty: True
Pushing the same data into the template in a single call gives the reference result. The two grids agree to rounding error, since only the order of the additions differs.
Max abs. difference of the binned mean: 0.0e+00
Histograms#
pyinterp.dask.histogram2d() works the same way with a
pyinterp.Histogram2D, which keeps a compressed histogram in each
bin and therefore gives access to quantiles such as the median. Like the
T-Digest, merging histograms is approximate for quantiles, but exact for
counts, means and extrema.
histogram = pyinterp.Histogram2D(
    pyinterp.Axis(numpy.arange(-180.0, 180.0, 5.0), period=360.0),
    pyinterp.Axis(numpy.arange(-80.0, 80.1, 5.0)),
)
hist = pyinterp.dask.histogram2d(x, y, z, histogram)
median = hist.quantile(0.5)
histogram.push(lon, lat, values)
numpy.testing.assert_array_equal(hist.count(), histogram.count())
diff = numpy.nanmax(numpy.abs(median - histogram.quantile(0.5)))
print(f"Max abs. difference of the binned median: {diff:.1e}")
Max abs. difference of the binned median: 0.0e+00
Visualizing the Results#
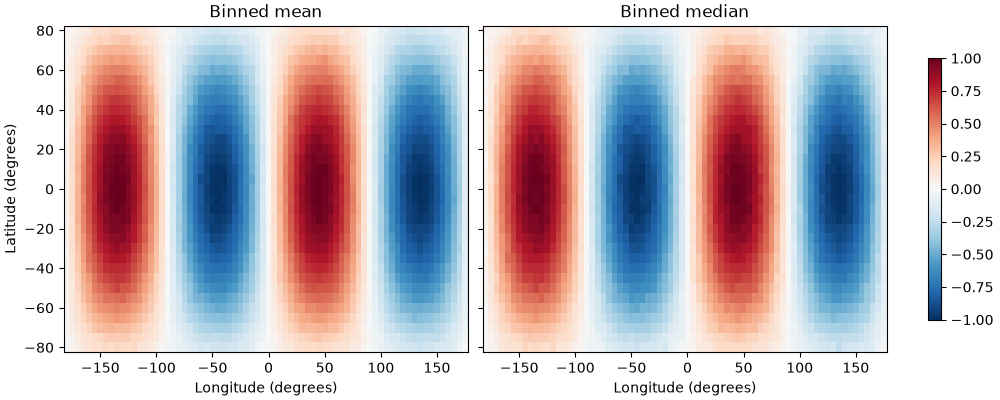
The mean computed by pyinterp.dask.binning2d() and the median
computed by pyinterp.dask.histogram2d() both recover the underlying
field from the noisy observations.
lon_grid = binned.x[:]
lat_grid = binned.y[:]
fig, axes = matplotlib.pyplot.subplots(1,
                                       2,
                                       figsize=(10, 4),
                                       layout="constrained",
                                       sharey=True)
for ax, data, title in zip(axes, (binned.mean(), median),
                           ("Binned mean", "Binned median"),
                           strict=True):
    pcm = ax.pcolormesh(lon_grid,
                        lat_grid,
                        data.T,
                        cmap="RdBu_r",
                        vmin=-1,
                        vmax=1,
                        shading="auto")
    ax.set_title(title)
    ax.set_xlabel("Longitude (degrees)")
axes[0].set_ylabel("Latitude (degrees)")
fig.colorbar(pcm, ax=axes, shrink=0.8)
matplotlib.pyplot.show()
See also
Binning explains the difference between simple and linear
binning, and Descriptive Statistics details the statistics
available on pyinterp.DescriptiveStatistics.
Total running time of the script: (0 minutes 1.780 seconds)
