

Note
Go to the end to download the full example code or to run this example in your browser via Binder.
Reduced Gaussian Grids#
ECMWF distributes its analyses and forecasts on reduced Gaussian grids: a fixed
set of parallels, the Gaussian latitudes, each holding equally spaced points
whose number decreases towards the poles. pyinterp.reduced_gaussian
interpolates them in 2D, in 3D (a column of model levels per point) and in
time, from numeric inputs only: the latitudes of the parallels, their number of
points and the values. In this example you will learn how to describe the mesh,
read only the part of a grid a pass needs, interpolate a series of 2D and 3D
grids along a satellite pass, and compute corrections from the interpolated
columns, with numpy or with a function compiled by numba. The last section
gives the same workflow on GRIB files read with ecCodes.
The data are a subset of the operational ECMWF N640 analyses of 2018-02-13 at 12h and 18h, in a box across the Greenwich meridian (4°W to 4°E, 42°N to 48°N): the surface pressure, and the temperature and the specific humidity on 9 of the 137 model levels.
import importlib.util

import matplotlib.pyplot
import numpy

import pyinterp.tests
from pyinterp import reduced_gaussian as rg


ds = pyinterp.tests.load_reduced_gaussian()
The Mesh#
The Mesh is the geometry alone: the
latitudes of the parallels, north to south, and their number of points. The
points are numbered parallel after parallel from the north, and on each
parallel eastwards from longitude 0, as a global GRIB field stores them.
gaussian_latitudes() and
octahedral_points() build the standard
meshes when no file is at hand.
mesh = rg.Mesh(ds.latitude.values, ds.pl.values)
print(f"{mesh.ny} parallels, {mesh.size} points")

fig, ax = matplotlib.pyplot.subplots(figsize=(8, 4), layout="constrained")
ax.plot(mesh.latitudes, mesh.points_per_parallel, label="N640 (this grid)")
octahedral = rg.octahedral_points(640)
ax.plot(rg.gaussian_latitudes(640), octahedral, label="O640 (octahedral)")
ax.set_xlabel("Latitude (degrees)")
ax.set_ylabel("Points per parallel")
ax.legend()
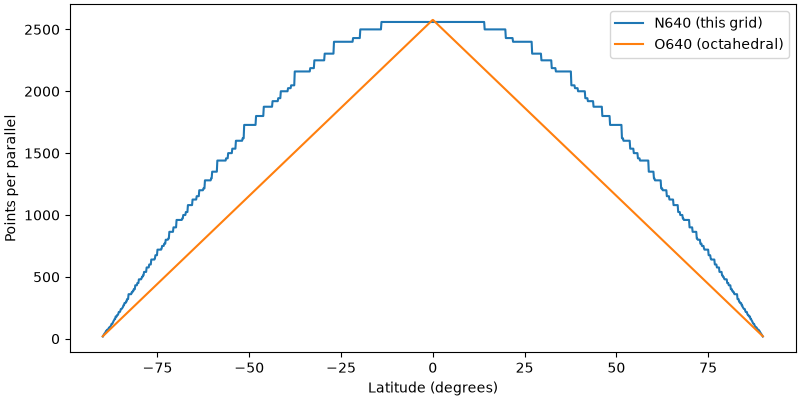
1280 parallels, 2140702 points

<matplotlib.legend.Legend object at 0x7d1144822270>
Reading Only a Zone#
A global N640 field holds 2.1 million points per level. A
Zone is the part of the mesh a regional
grid holds: sorted ranges [start, stop) of the flat indices of the
mesh, computed from the mesh alone, before any value is read. The
dataset stores the zone of its box; Zone.from_box computes it again from the box,
given unwrapped across the Greenwich meridian.
box = rg.Zone.from_box(mesh, -4.0, 42.0, 4.0, 48.0)
assert box == rg.Zone(mesh, ds.ranges.values)
print(f"Box: {box.size} points in {box.num_ranges} ranges")
Box: 1904 points in 45 ranges
For a satellite pass, Zone.from_points holds exactly the corners the
points read: a pass is a thin line, far smaller than its bounding box. The
pass below crosses the box in one hour, between the two analyses.
Pass: 146 points in 39 ranges
The values of a zone are read with its
indices(), which index a NumPy array
or make an orthogonal selection in a Zarr or netCDF variable, or with its
ranges() for readers that seek in a
file. Many small reads cost more than a few larger ones:
coalesce() merges the ranges closer than a
gap, and gives the positions of the values of the zone in what was read.
The pass reads a few points per parallel, about 2000 points apart on these
parallels: a gap of 5000 points reads the zone at once.
io_gap=    0:  39 reads,   146 points read
io_gap= 1000:  39 reads,   146 points read
io_gap= 5000:   1 reads, 70841 points read
Here the dataset holds the values of the box. The values of the pass are those of the box at the indices of the pass: a zone maps a flat index of the mesh to the row of its values.
A Series of 2D Grids#
A Grid holds the fields of one time
step, on the mesh or on a zone: float32 or float64 arrays of shape
(points,), read without copy. A
Series holds the steps. Each step may
hold its own zone, which time_zones()
computes from the points whose date reads the step.
zones = rg.time_zones(mesh, ds.time.values, dates, lon, lat)
surface = rg.Series(mesh)
for k, (time, zone) in enumerate(zip(ds.time.values, zones, strict=True)):
    sp = ds.sp.values[k][box.rows(zone.indices())]
    surface.append(time, rg.Grid(mesh, {"sp": sp}, zone=zone))
    print(f"{time}: {zone.size} points")
2018-02-13T12:00:00.000000000: 146 points
2018-02-13T18:00:00.000000000: 146 points
interpolate() locates each point once on
the mesh, interpolates the two analyses that bracket its date on the
trapezoidal cell around it, and blends them in time.
sp = rg.interpolate(surface, lon, lat, dates)["sp"]
at12, at18 = (
    rg.interpolate(surface, lon, lat, numpy.full(lon.size, time))["sp"]
    for time in ds.time.values
)
nearest = rg.interpolate(surface, lon, lat, dates, time_method="nearest")

fig, ax = matplotlib.pyplot.subplots(figsize=(8, 4), layout="constrained")
ax.plot(lat, at12 / 100, ":", label="12h analysis")
ax.plot(lat, at18 / 100, ":", label="18h analysis")
ax.plot(lat, sp / 100, label="13h-14h, linear in time")
ax.plot(lat, nearest["sp"] / 100, "--", label="nearest in time")
ax.set_xlabel("Latitude of the pass (degrees)")
ax.set_ylabel("Surface pressure (hPa)")
ax.legend()
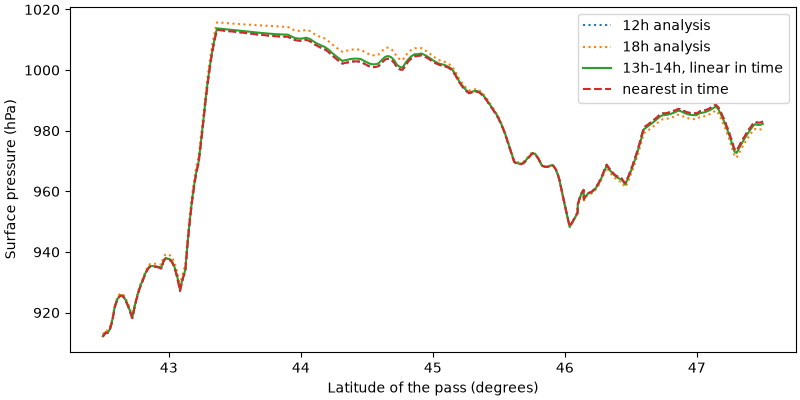
<matplotlib.legend.Legend object at 0x7d11448ec2f0>
A computation point by point from 2D fields needs nothing more than NumPy: here the dry tropospheric correction from the surface pressure.
Dry tropospheric correction: -2.309 to -2.078 m
The interval option reads a date between the two ends of the analysis
interval it falls in, as the altimetry processors do, and
map_availability() counts the ends that
are missing: 0 when the value is interpolated, 1 when it is read off a
single analysis, 2 when nothing is computed.
six_hours = numpy.timedelta64(6, "h")
later = dates + numpy.timedelta64(6, "h")  # between 18h and the missing 00h
flags = rg.map_availability(surface.dates, later, six_hours)
held = rg.interpolate(surface, lon, lat, later, interval=six_hours)["sp"]
print(f"Flags: {numpy.bincount(flags, minlength=3)}")
assert numpy.allclose(held, at18)
Flags: [ 0 3600 0]
A Series of 3D Grids#
A 3D field has shape (points, levels): the column of a point is
contiguous. The hybrid coefficients a and b of the half levels
describe the vertical grid: the pressure of half level k is
a[k] + b[k] * sp.
levels = rg.Series(mesh)
for k, (time, zone) in enumerate(zip(ds.time.values, zones, strict=True)):
    rows = box.rows(zone.indices())
    fields = {
        "t": numpy.ascontiguousarray(ds.t.values[k][rows]),
        "q": numpy.ascontiguousarray(ds.q.values[k][rows]),
        "sp": ds.sp.values[k][rows],
    }
    levels.append(
        time,
        rg.Grid(mesh, fields, zone=zone, a=ds.a.values, b=ds.b.values),
    )
columns = rg.interpolate(levels, lon, lat, dates)
print({name: values.shape for name, values in columns.items()})

fig, (ax1, ax2) = matplotlib.pyplot.subplots(
    1, 2, figsize=(8, 4), sharey=True, layout="constrained"
)
for ix in (0, lon.size // 2, lon.size - 1):
    label = f"{lat[ix]:.1f}°N, {lon[ix]:.1f}°E"
    ax1.plot(columns["t"][ix], ds.level.values, "o-", label=label)
    ax2.plot(columns["q"][ix] * 1e3, ds.level.values, "o-", label=label)
ax1.invert_yaxis()
ax1.set_xlabel("Temperature (K)")
ax2.set_xlabel("Specific humidity (g/kg)")
ax1.set_ylabel("Model level")
ax2.legend()
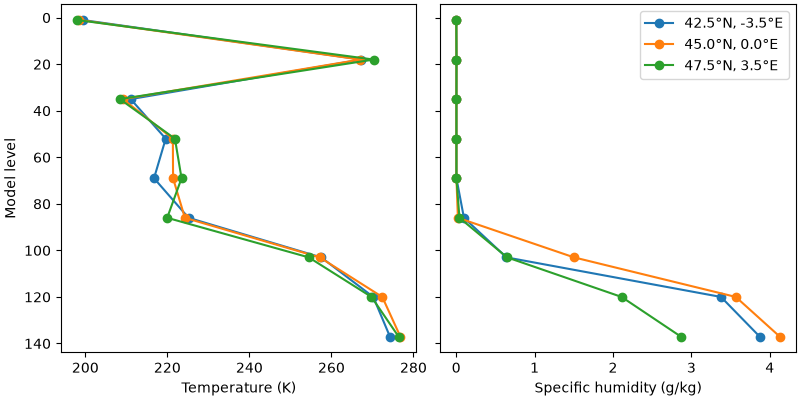
{'t': (3600, 9), 'q': (3600, 9), 'sp': (3600,)}

<matplotlib.legend.Legend object at 0x7d113da93230>
Computing From the Columns#
apply() computes values per point from the
interpolated columns without holding them all: the columns are interpolated
in C++, in parallel, and given to a Python function by blocks of points,
with the coordinates of the points and the extra arguments args. Here,
the pressure at the altitude of each measurement, reduced from the surface
with the virtual temperature of the lowest level, and the dry correction
there. The function is an illustration, not the algorithm of a processor.
rng = numpy.random.default_rng(0)
height = rng.uniform(0.0, 500.0, lon.size)
GRAVITY, RD = 9.80665, 287.05


def pressure_at_height(columns, points, a, b):
    """Pressure at the measurement altitude and its dry correction."""
    t, q = columns["t"][:, -1], columns["q"][:, -1]
    virtual = t * (1.0 + 0.608 * q)
    pressure = columns["sp"] * numpy.exp(
        -GRAVITY * points["height"] / (RD * virtual)
    )
    cos2 = numpy.cos(numpy.radians(2.0 * points["lat"]))
    return numpy.stack(
        [pressure, -2.277e-5 * pressure * (1.0 + 0.0026 * cos2)], axis=1
    )


result = rg.apply(
    levels,
    pressure_at_height,
    lon,
    lat,
    dates,
    args={"height": height},
    n_out=2,
)
print(
    f"Pressure at altitude: {result[:, 0].min() / 100:.1f} to "
    f"{result[:, 0].max() / 100:.1f} hPa"
)
Pressure at altitude: 858.6 to 1013.0 hPa
A computation that loops over the levels, such as a vertical integration,
does not vectorize over points.
column_kernel() compiles it with numba into
a native kernel that apply calls for each point, from several threads and
without the GIL. The kernel receives the fields concatenated in columns
(widths[k] values for field k, in the order of the grid), the hybrid
coefficients, and point: the longitude, the latitude, the date (for a
series) then the extra arguments. It returns 0, or a non-zero code that makes
the point NaN.
if importlib.util.find_spec("numba") is not None:
    import numba

    @rg.column_kernel(n_out=2)
    def kernel(columns, widths, a, b, point, out):
        """Same computation, for one point."""
        n = widths[0]  # t, then q, then sp
        t, q, sp = columns[n - 1], columns[2 * n - 1], columns[2 * n]
        virtual = t * (1.0 + 0.608 * q)
        pressure = sp * numpy.exp(-GRAVITY * point[3] / (RD * virtual))
        cos2 = numpy.cos(numpy.radians(2.0 * point[1]))
        out[0] = pressure
        out[1] = -2.277e-5 * pressure * (1.0 + 0.0026 * cos2)
        return 0

    native = rg.apply(levels, kernel, lon, lat, dates, args={"height": height})
    print(
        f"numba {numba.__version__}: max difference with the Python "
        f"function {numpy.abs(native - result).max():.1e}"
    )
else:
    print("numba is not installed: pip install numba to run the kernel")
numba 0.68.0: max difference with the Python function 0.0e+00
For a series, blend="columns" (the default) blends the columns of the
two analyses and calls the function once; blend="results" calls it on
the columns of each analysis and blends its results, which costs twice as
much: it interpolates in time the result rather than the fields, which
differs when the function is nonlinear in them.
by_results = rg.apply(
    levels,
    pressure_at_height,
    lon,
    lat,
    dates,
    args={"height": height},
    n_out=2,
    blend="results",
)
print(
    f"Results minus columns: "
    f"{numpy.abs(by_results - result)[:, 0].max():.2e} Pa"
)
Results minus columns: 1.84e-01 Pa
Reading GRIB Files With ecCodes#
pyinterp takes numbers only and never reads GRIB itself. The functions
below read a global reduced_gg field with ecCodes (conda install -c
conda-forge eccodes python-eccodes) and feed the workflow above. They
assume one variable per file and one message per level, as the ECMWF
meteorological files of the altimetry processors are delivered.
The mesh and the hybrid coefficients come from the first message:
import os

import eccodes
import numpy as np

from pyinterp import reduced_gaussian as rg


def read_mesh(path):
    """Mesh and hybrid coefficients of the first message of a file."""
    with open(path, "rb") as stream:
        handle = eccodes.codes_grib_new_from_file(stream)
    try:
        if eccodes.codes_get(handle, "gridType") != "reduced_gg":
            raise ValueError("not a reduced Gaussian grid")
        # pyinterp numbers the points from the north, eastwards from 0.
        if (
            eccodes.codes_get(handle, "jScansPositively") != 0
            or eccodes.codes_get(handle, "iScansNegatively") != 0
            or eccodes.codes_get(
                handle, "longitudeOfFirstGridPointInDegrees"
            ) != 0
        ):
            raise ValueError("unsupported scanning mode")
        latitudes = eccodes.codes_get_array(handle, "distinctLatitudes")
        latitudes = np.sort(latitudes)[::-1].copy()  # north to south
        pl = eccodes.codes_get_array(handle, "pl").astype(np.int64)
        a = b = None
        if eccodes.codes_get(handle, "NV") > 0:
            pv = eccodes.codes_get_array(handle, "pv")
            a, b = pv[: len(pv) // 2].copy(), pv[len(pv) // 2 :].copy()
        return rg.Mesh(latitudes, pl), a, b
    finally:
        eccodes.codes_release(handle)


def validity(path):
    """Validity date of the first message of a file."""
    with open(path, "rb") as stream:
        handle = eccodes.codes_grib_new_from_file(stream)
    try:
        date = str(eccodes.codes_get(handle, "validityDate"))
        time = f"{eccodes.codes_get(handle, 'validityTime'):04d}"
        return np.datetime64(
            f"{date[:4]}-{date[4:6]}-{date[6:]}T{time[:2]}:{time[2:]}",
            "ns",
        )
    finally:
        eccodes.codes_release(handle)


def messages(path):
    """Offset of each message of a file, in the order of the levels."""
    offsets = {}
    with open(path, "rb") as stream:
        while (
            handle := eccodes.codes_grib_new_from_file(stream)
        ) is not None:
            try:
                level = eccodes.codes_get(handle, "level")
                offsets[level] = int(eccodes.codes_get(handle, "offset"))
            finally:
                eccodes.codes_release(handle)
    return [offsets[level] for level in sorted(offsets)]
The values of a zone are read in either of two ways. The first decodes each message whole and keeps the points of the zone: it works for any packing, and saves the memory and the copies of the global field:
def read_zone(path, zone):
    """The values of a zone: (points,) or (points, levels)."""
    index = zone.indices()
    columns = []
    with open(path, "rb") as stream:
        for offset in messages(path):
            stream.seek(offset)
            handle = eccodes.codes_grib_new_from_file(stream)
            try:
                columns.append(eccodes.codes_get_values(handle)[index])
            finally:
                eccodes.codes_release(handle)
    return columns[0] if len(columns) == 1 else np.stack(columns, axis=1)
The second reads from the file only the bytes of the zone. It needs the
grid_simple packing without bitmap, where value i is an unsigned
integer of bitsPerValue bits at a known offset, decoded as
\((R + X\,2^E) / 10^D\). On the N640 files of this dataset, reading a
regional box this way is five to nine times faster than decoding the
messages whole. coalesce merges the ranges closer than io_gap points
into one read:
def read_zone_simple(path, zone, io_gap=256):
    """The values of a zone, reading only its bytes (grid_simple)."""
    merged, gather = rg.coalesce(zone.ranges(), io_gap)
    columns = []
    descriptor = os.open(path, os.O_RDONLY)
    try:
        with open(path, "rb") as stream:
            for offset in messages(path):
                stream.seek(offset)
                handle = eccodes.codes_grib_new_from_file(stream)
                try:
                    get = lambda key: eccodes.codes_get(handle, key)
                    if get("packingType") != "grid_simple" or get(
                        "bitmapPresent"
                    ):
                        raise ValueError("use read_zone")
                    size = get("bitsPerValue") // 8
                    if get("bitsPerValue") not in (8, 16, 32):
                        raise ValueError("use read_zone")
                    if get("editionNumber") == 1:
                        first = int(get("offsetSection4")) + 11
                    else:
                        first = int(get("offsetSection7")) + 5
                    reference = get("referenceValue")
                    binary = get("binaryScaleFactor")
                    decimal = get("decimalScaleFactor")
                finally:
                    eccodes.codes_release(handle)
                packed = b"".join(
                    os.pread(
                        descriptor,
                        size * int(stop - start),
                        offset + first + size * int(start),
                    )
                    for start, stop in merged
                )
                raw = np.frombuffer(packed, dtype=f">u{size}")[gather]
                columns.append((reference + raw * 2.0**binary)
                               / 10.0**decimal)
    finally:
        os.close(descriptor)
    return columns[0] if len(columns) == 1 else np.stack(columns, axis=1)
With them, a pass is processed from the files of its analyses, reading for each analysis only the points the pass reads from it:
# One dict per analysis: field name -> GRIB file.
files = {
    validity(paths["t"]): paths
    for paths in (
        {"t": "T3A_12h.grib", "q": "Q3A_12h.grib", "sp": "PRA_12h.grib"},
        {"t": "T3A_18h.grib", "q": "Q3A_18h.grib", "sp": "PRA_18h.grib"},
    )
}
steps = np.array(sorted(files))
mesh, a, b = read_mesh(files[steps[0]]["t"])
interval = np.timedelta64(6, "h")

# lon, lat, dates: the measurements of the pass.
zones = rg.time_zones(mesh, steps, dates, lon, lat, interval=interval)
series = rg.Series(mesh)
for step, zone in zip(steps, zones):
    if zone.size == 0:  # no measurement reads this analysis
        continue
    fields = {
        name: read_zone_simple(path, zone)
        for name, path in files[step].items()
    }
    series.append(step, rg.Grid(mesh, fields, zone=zone, a=a, b=b))

columns = rg.interpolate(series, lon, lat, dates, interval=interval)
flags = rg.map_availability(steps, dates, interval)
The 3D fields come back with the levels in the order of the GRIB level
key, top of the atmosphere first, as the coefficients a and b.
Total running time of the script: (0 minutes 1.560 seconds)
