

Note
Go to the end to download the full example code or to run this example in your browser via Binder.
Conservative Regridding#
Interpolating a fine grid onto a coarse one samples it: each target value
comes from the few source nodes around a point, and the small scales between
the target points are lost or aliased. Conservative regridding averages it
instead: each target cell receives the mean of the source values weighted by
the area of their overlap with the cell, which preserves the integral of the
field. In this example you will learn how to coarsen a grid with the
pyinterp accessor, handle undefined values, regrid a variable with a time
dimension, and average over a single box.
import matplotlib.pyplot
import numpy

import pyinterp
import pyinterp.backends.xarray
import pyinterp.tests
Coarsening a Grid#
We load the global mean sea surface (MSS) at 0.25°, stored as (lat,
lon) with longitudes in [0, 360) and NaN over land. The
regrid() method takes the
centers of the target cells as keyword arguments, like
interp(): here a 2° grid
in [-180, 180). The longitude and latitude are recognized from their units,
and the bounds of the cells are the midpoints between the centers.
mss = pyinterp.tests.load_grid2d().mss
lon = numpy.arange(-180, 180, 2.0) + 1
lat = numpy.arange(-90, 90, 2.0) + 1
conservative = mss.pyinterp.regrid(lon=lon, lat=lat)
bilinear = mss.pyinterp.interp(lon=lon, lat=lat)
print(conservative)
<xarray.DataArray 'mss' (lat: 90, lon: 180)> Size: 130kB
array([[nan, nan, nan, ..., nan, nan, nan],
       [nan, nan, nan, ..., nan, nan, nan],
       [nan, nan, nan, ..., nan, nan, nan],
       ...,
       [nan, nan, nan, ..., nan, nan, nan],
       [nan, nan, nan, ..., nan, nan, nan],
       [nan, nan, nan, ..., nan, nan, nan]], shape=(90, 180))
Coordinates:
  * lat      (lat) float64 720B -89.0 -87.0 -85.0 -83.0 ... 83.0 85.0 87.0 89.0
  * lon      (lon) float64 1kB -179.0 -177.0 -175.0 -173.0 ... 175.0 177.0 179.0
Attributes:
    long_name:     Mean sea surface height above reference ellipsoid
    units:         m
    grid_mapping:  crs
    source:        SMO15_1s60_V2.dat
    cell_methods:  lon: point lat: point
The undefined values are ignored: a coastal cell gets the mean of its ocean part, so the conservative regridding keeps cells that the bilinear interpolation loses as soon as one of the four surrounding nodes is on land.
print(
    f"Defined cells: conservative={int(conservative.notnull().sum())}, "
    f"bilinear={int(bilinear.notnull().sum())}"
)
fig, (ax1, ax2) = matplotlib.pyplot.subplots(
    2, 1, figsize=(10, 7), sharex=True, layout="constrained"
)
pcm = ax1.pcolormesh(lon, lat, conservative, vmin=-0.1, vmax=0.1)
fig.colorbar(pcm, ax=ax1, label="MSS (m)")
ax1.set_title("Conservative regridding onto 2° cells")
pcm = ax2.pcolormesh(
    lon,
    lat,
    (conservative - bilinear) * 1e3,
    cmap="RdBu_r",
    vmin=-2,
    vmax=2,
)
fig.colorbar(pcm, ax=ax2, label="mm")
ax2.set_title("Conservative minus bilinear")
ax2.set_xlabel("Longitude (degrees)")
for ax in (ax1, ax2):
    ax.set_ylabel("Latitude (degrees)")
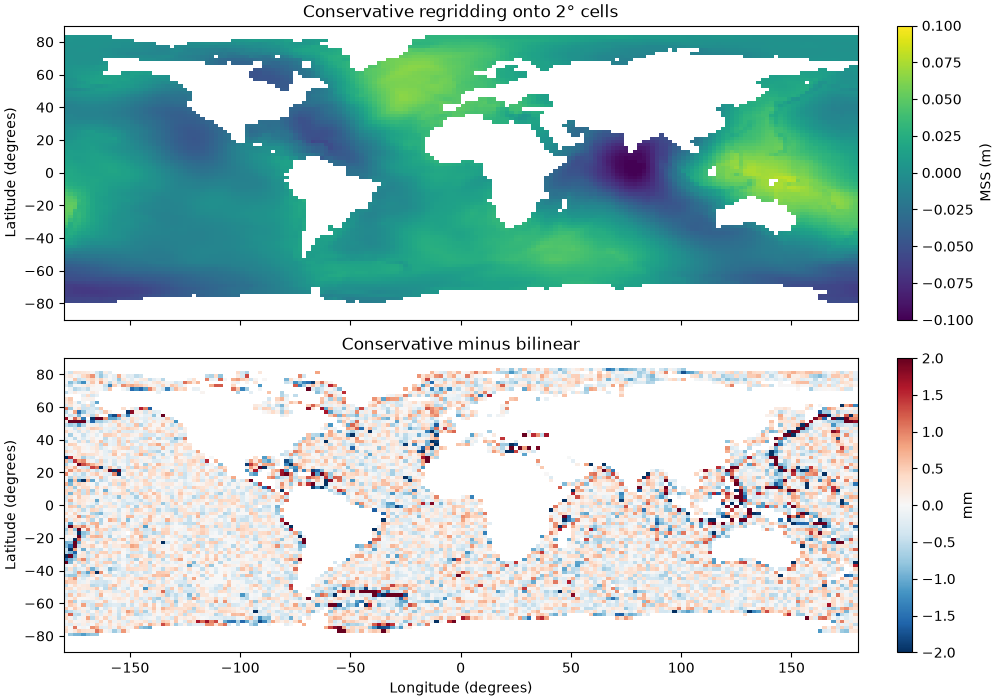
Defined cells: conservative=11099, bilinear=9752
Preserving the Integral#
The area of a longitude/latitude cell is proportional to its width in
longitude times the difference of the sines of its latitudes, which
pyinterp.regrid.cell_bounds() gives from the centers of the cells.
With normalize=False, the undefined values count as zero: the integral
of the field over the sphere is then preserved exactly.
def integral(data, lon_name="lon", lat_name="lat"):
    """Integral of a field over the sphere of radius 1, NaN counting as 0."""
    x = pyinterp.regrid.cell_bounds(data[lon_name].values, "longitude")
    y = pyinterp.regrid.cell_bounds(data[lat_name].values, "latitude")
    areas = numpy.outer(
        numpy.diff(numpy.sin(numpy.radians(y)))[:, 0],
        numpy.radians(numpy.diff(x)[:, 0]),
    )
    return numpy.nansum(data.values * areas)


zero = mss.pyinterp.regrid(lon=lon, lat=lat, normalize=False)
print(f"Integral on the 0.25° grid: {integral(mss):.10f}")
print(f"Integral on the 2° grid:    {integral(zero):.10f}")
Integral on the 0.25° grid: 0.0076671459
Integral on the 2° grid:    0.0076671459
With min_valid_fraction, a cell whose defined values cover less than
this fraction of its area is undefined: with 1, only the cells entirely over
the ocean keep a value.
ocean_only = mss.pyinterp.regrid(lon=lon, lat=lat, min_valid_fraction=1.0)
print(f"Cells entirely over the ocean: {int(ocean_only.notnull().sum())}")
Cells entirely over the ocean: 6729
Other Dimensions#
The dimensions that are not regridded, such as the time, are kept with
their coordinates. Here the daily total column water vapor, stored as
(time, latitude, longitude), is coarsened to 2.5° in one call.
tcw = pyinterp.tests.load_grid3d().tcw
daily = tcw.pyinterp.regrid(
    longitude=numpy.arange(0, 360, 2.5) + 1.25,
    latitude=numpy.arange(-80, 80, 2.5) + 1.25,
)
print(daily.dims, daily.shape)
('time', 'latitude', 'longitude') (31, 64, 144)
Averaging over a Box#
A dimension of a single cell cannot be inferred from its center: give the
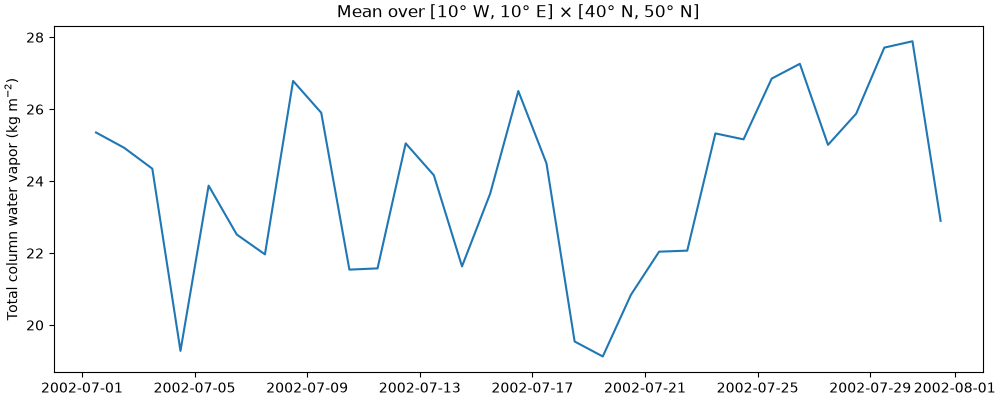
bounds of the cells instead, an array of shape (n, 2). The mean water
vapor over the box [10° W, 10° E] × [40° N, 50° N] is a time series.
box = tcw.pyinterp.regrid(
    longitude=[[-10.0, 10.0]], latitude=[[40.0, 50.0]]
).squeeze()
fig, ax = matplotlib.pyplot.subplots(figsize=(10, 4), layout="constrained")
ax.plot(box.time, box)
ax.set_ylabel("Total column water vapor (kg m$^{-2}$)")
ax.set_title("Mean over [10° W, 10° E] × [40° N, 50° N]")
Text(0.5, 1.0, 'Mean over [10° W, 10° E] × [40° N, 50° N]')
Total running time of the script: (0 minutes 1.074 seconds)
