Note
Go to the end to download the full example code. or to run this example in your browser via Binder
Geohash
Geohashing is a geocoding method used to encode geographic coordinates (latitude and longitude) into a short string of digits and letters delineating an area on a map, which is called a cell, with varying resolutions. The more characters in the string, the more precise the location.
Geohash Grid
import timeit

import cartopy.crs
import matplotlib.colors
import matplotlib.patches
import matplotlib.pyplot
import numpy
import pandas

import pyinterp
Writing a visualization routine for GeoHash grids.
def _sort_colors(colors):
    """Sort colors by hue, saturation, value and name in descending order."""
    by_hsv = sorted(
        (tuple(matplotlib.colors.rgb_to_hsv(matplotlib.colors.to_rgb(color))),
         name) for name, color in colors.items())
    return [name for hsv, name in reversed(by_hsv)]


def _plot_box(ax, code, color, caption=True):
    """Plot a GeoHash bounding box."""
    box = pyinterp.GeoHash.from_string(code.decode()).bounding_box()
    x0 = box.min_corner.lon
    x1 = box.max_corner.lon
    y0 = box.min_corner.lat
    y1 = box.max_corner.lat
    dx = x1 - x0
    dy = y1 - y0
    box = matplotlib.patches.Rectangle((x0, y0),
                                       dx,
                                       dy,
                                       alpha=0.5,
                                       color=color,
                                       ec='black',
                                       lw=1,
                                       transform=cartopy.crs.PlateCarree())
    ax.add_artist(box)
    if not caption:
        return
    rx, ry = box.get_xy()
    cx = rx + box.get_width() * 0.5
    cy = ry + box.get_height() * 0.5
    ax.annotate(code.decode(), (cx, cy),
                color='w',
                weight='bold',
                fontsize=16,
                ha='center',
                va='center')


def plot_geohash_grid(precision,
                      polygon=None,
                      caption=True,
                      color_list=None,
                      inc=7):
    """Plot geohash bounding boxes."""
    color_list = color_list or matplotlib.colors.CSS4_COLORS
    fig = matplotlib.pyplot.figure(figsize=(24, 12))
    ax = fig.add_subplot(1, 1, 1, projection=cartopy.crs.PlateCarree())
    if polygon is not None:
        box = polygon.envelope() if isinstance(
            polygon, pyinterp.geodetic.Polygon) else polygon

        ax.set_extent(
            [
                box.min_corner.lon,
                box.max_corner.lon,
                box.min_corner.lat,
                box.max_corner.lat,
            ],
            crs=cartopy.crs.PlateCarree(),
        )
    else:
        box = None
    colors = _sort_colors(color_list)
    ic = 0
    codes = pyinterp.geohash.bounding_boxes(polygon, precision=precision)

    color_codes = {codes[0][0]: colors[ic]}
    for item in codes:
        prefix = item[precision - 1]
        if prefix not in color_codes:
            ic += inc
            color_codes[prefix] = colors[ic % len(colors)]
        _plot_box(ax, item, color_codes[prefix], caption)
    ax.stock_img()
    ax.coastlines()
    ax.grid()
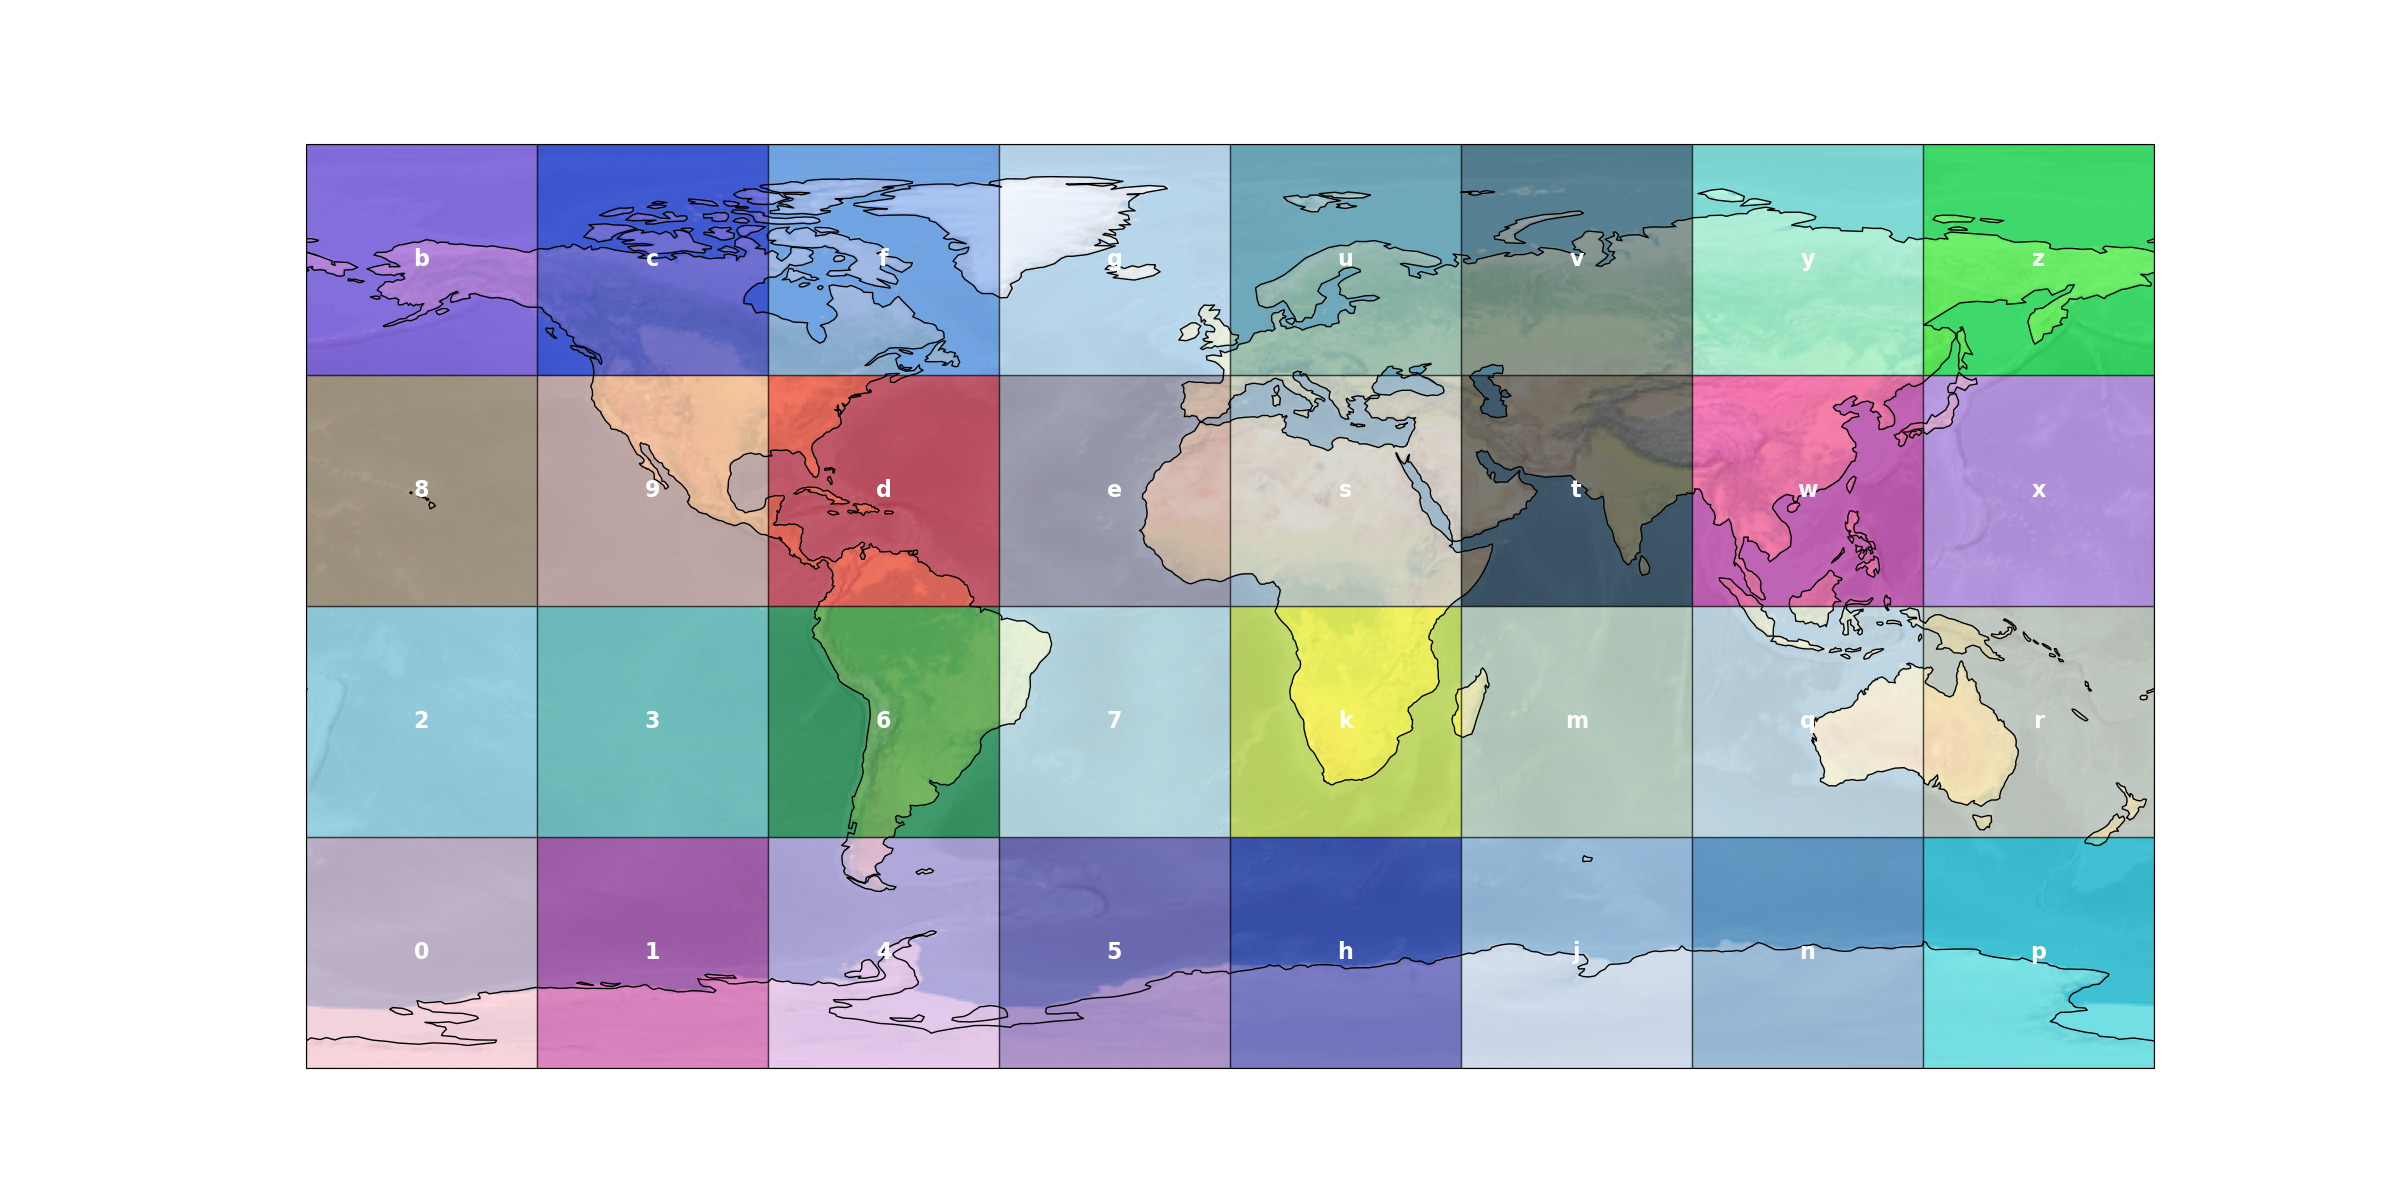
Bounds of geohash with a precision of 1 character.
plot_geohash_grid(1)
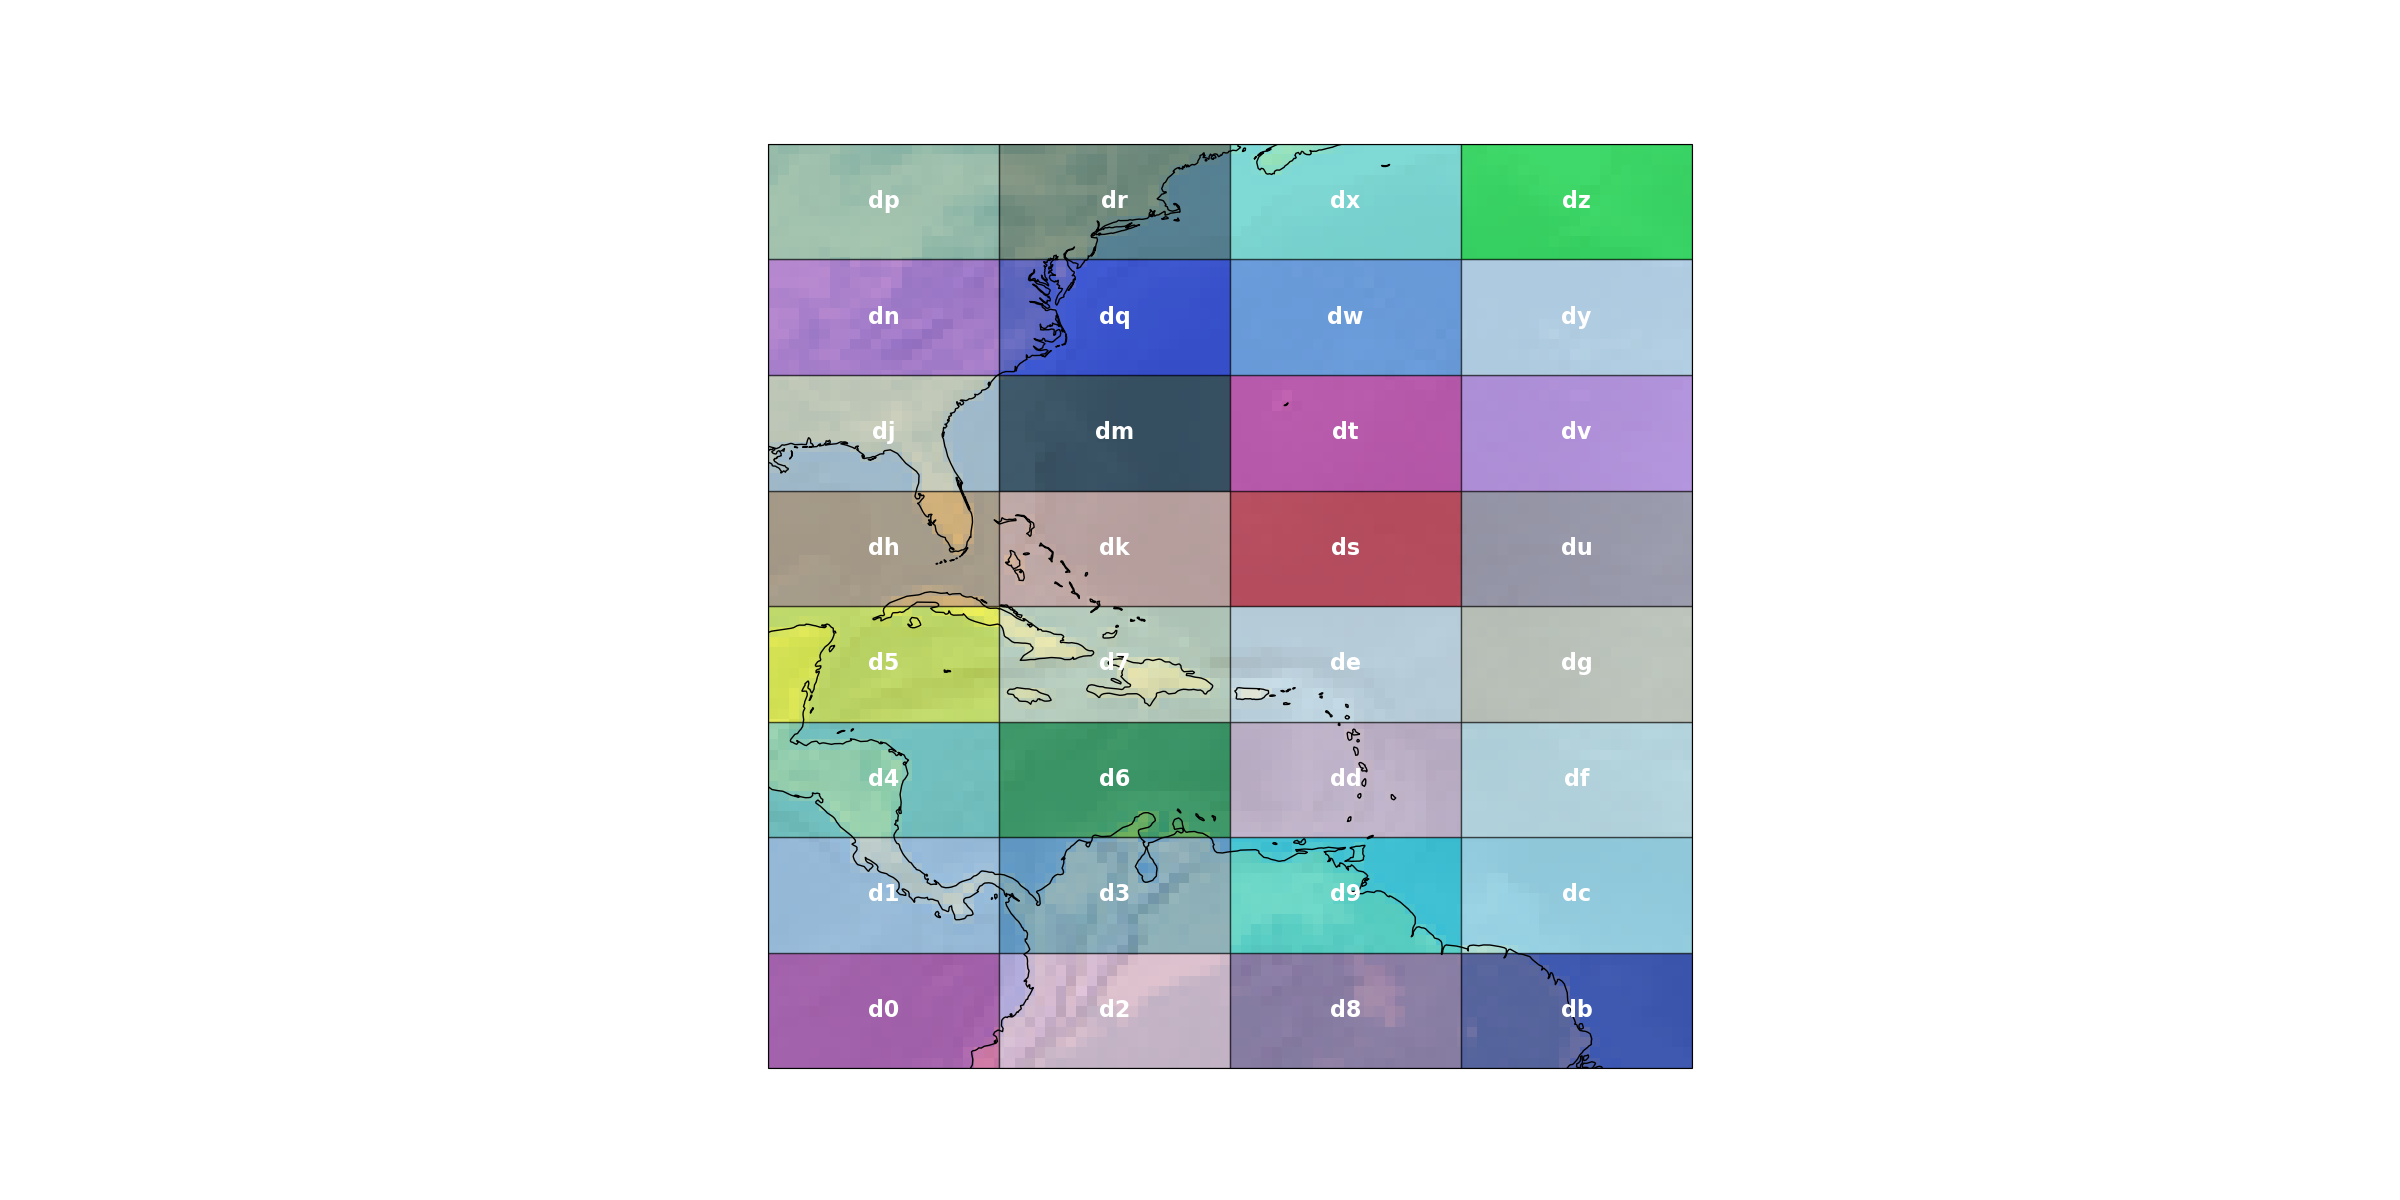
Bounds of the geohash d with a precision of two characters.
plot_geohash_grid(2, polygon=pyinterp.GeoHash.from_string('d').bounding_box())
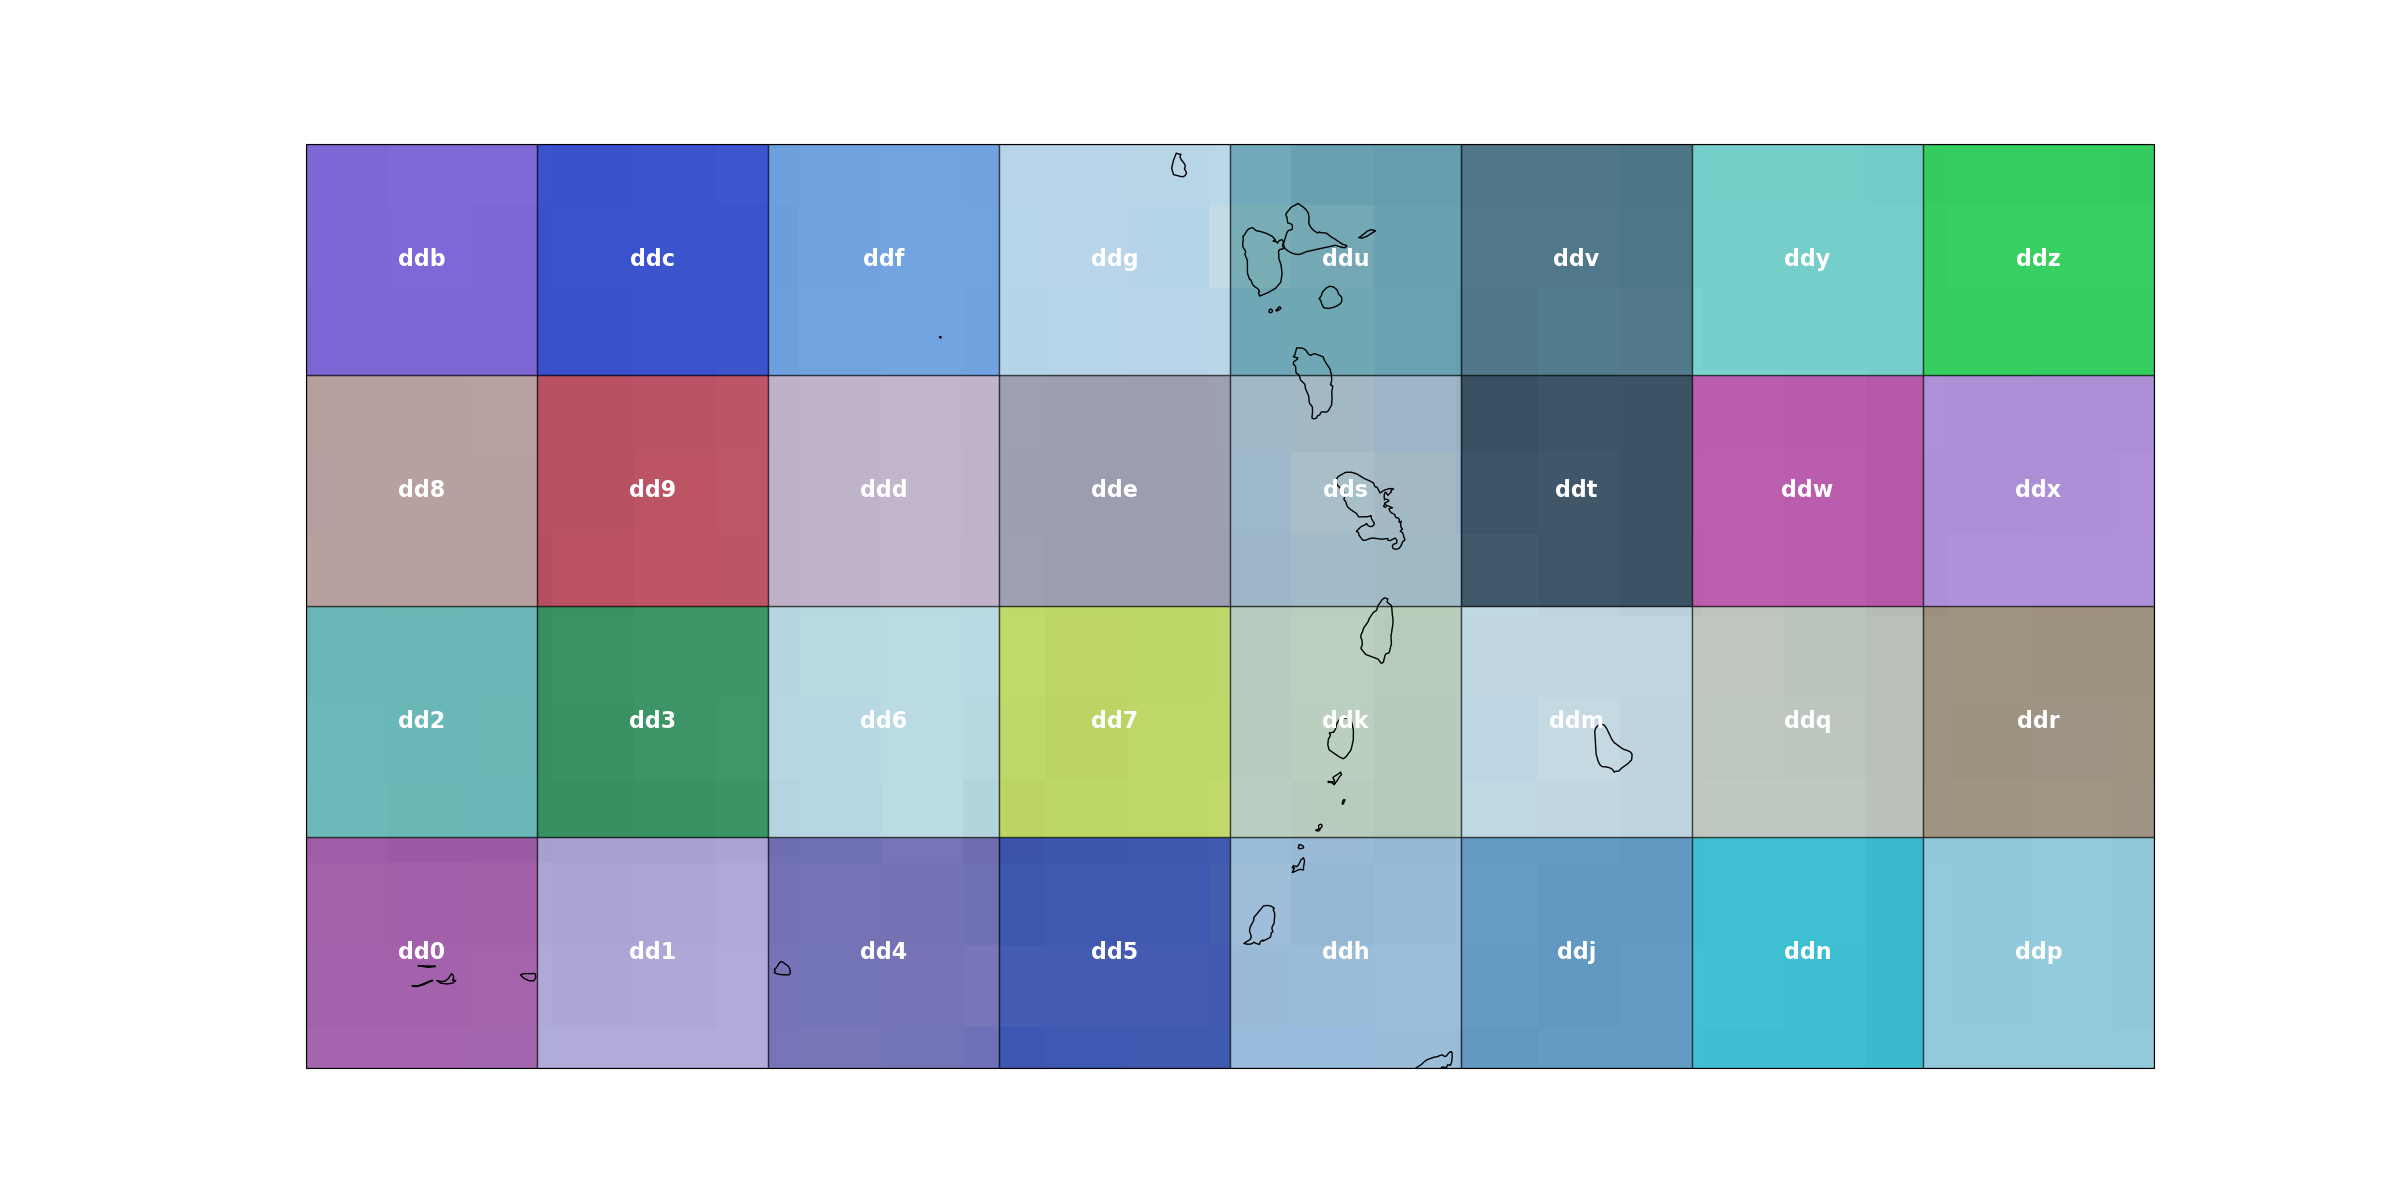
Bounds of the geohash dd with a precision of three characters.
plot_geohash_grid(3, polygon=pyinterp.GeoHash.from_string('dd').bounding_box())
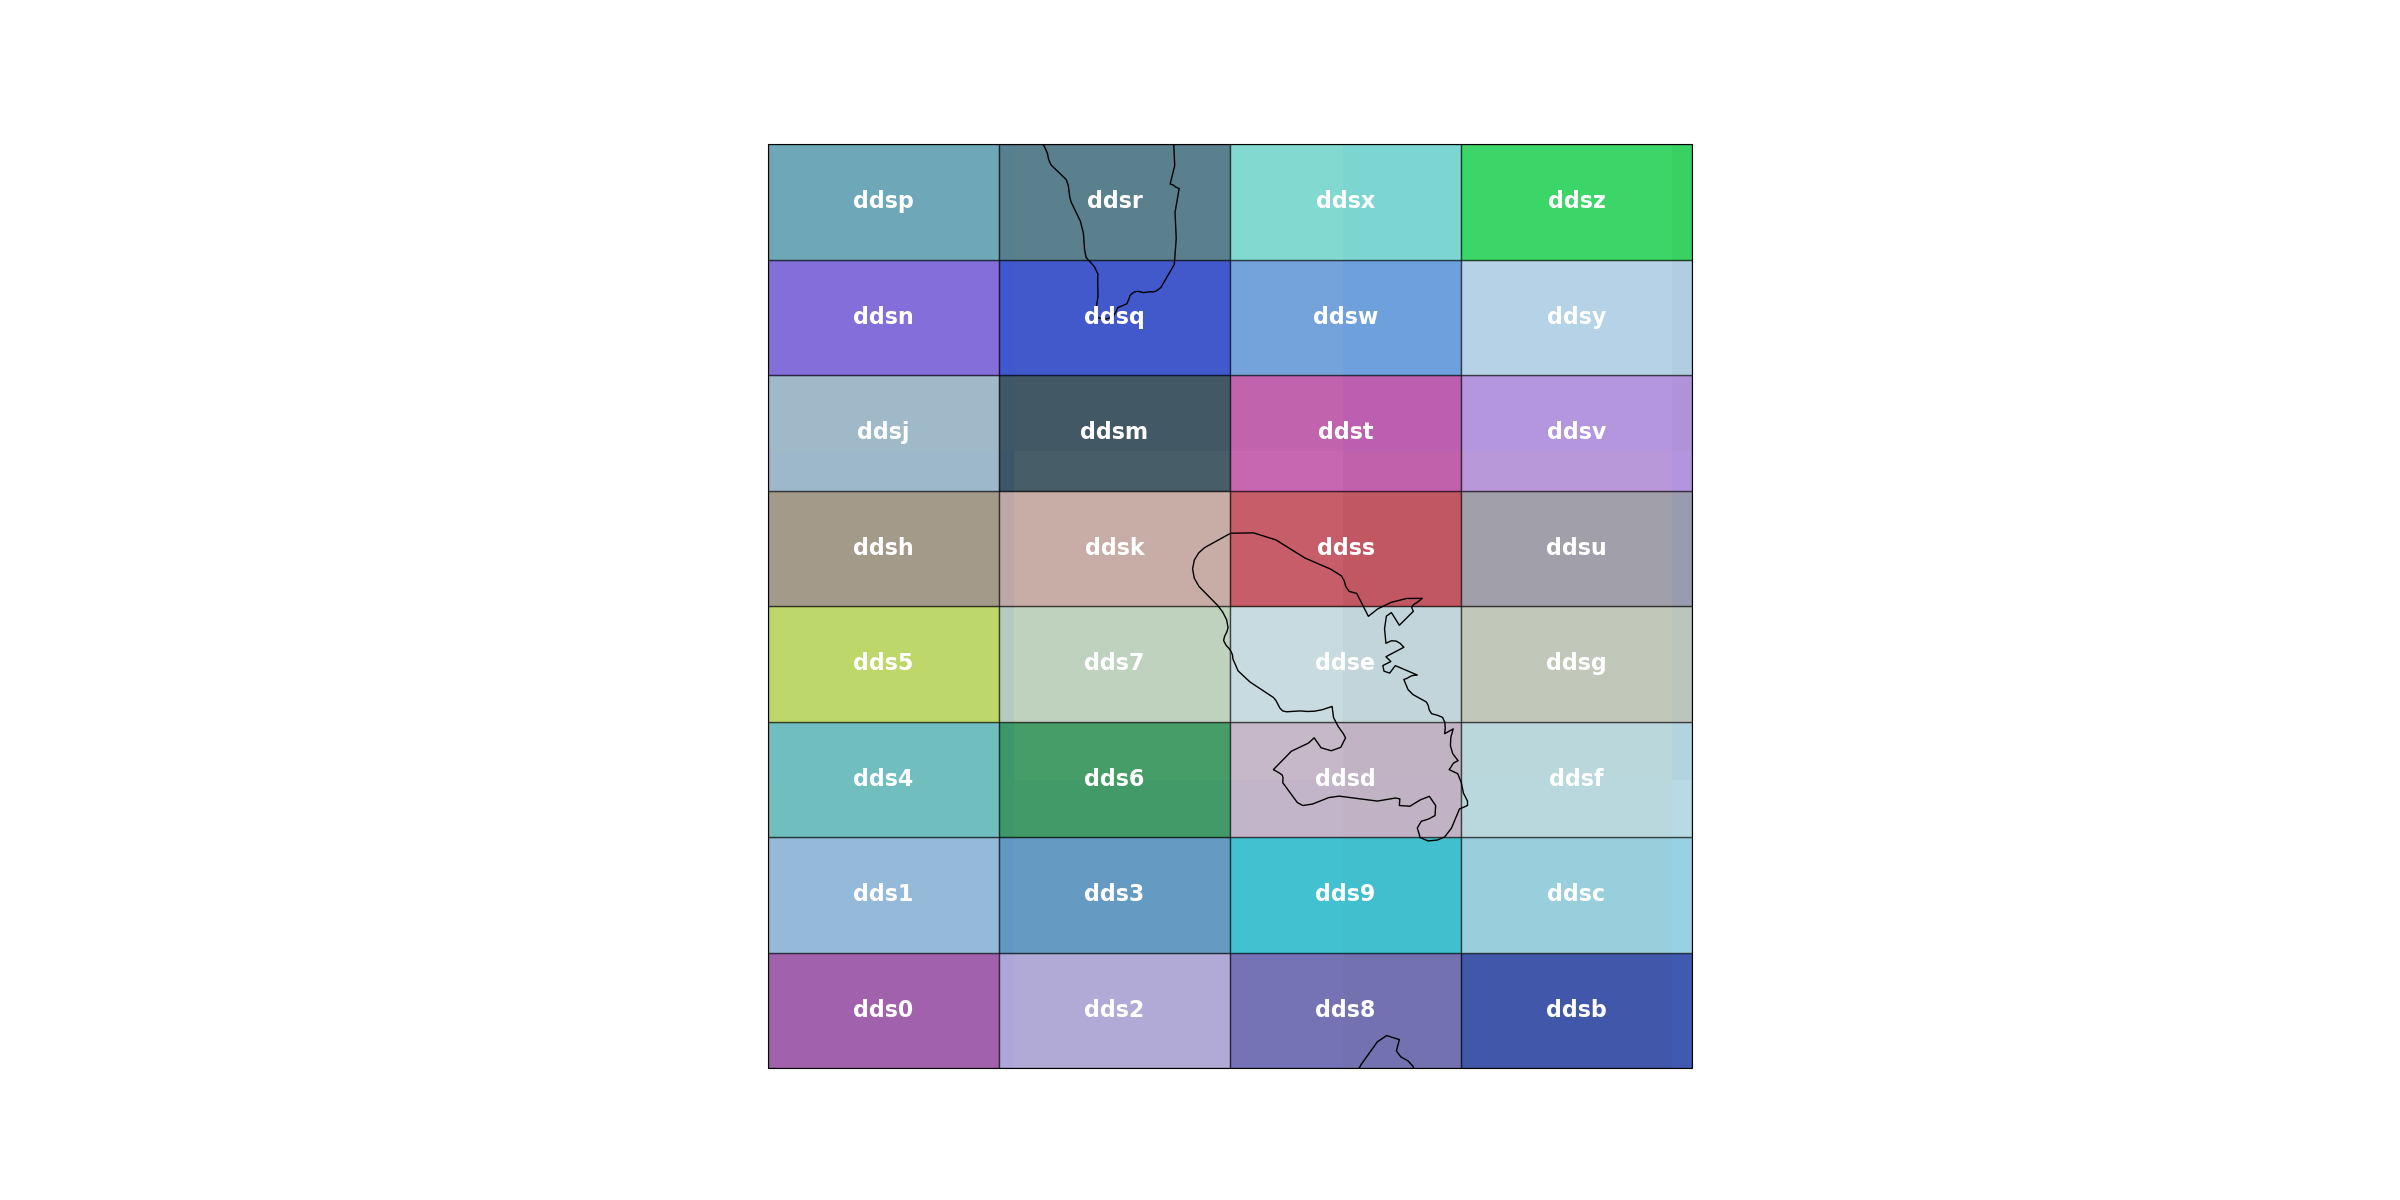
Bounds of the geohash dds with a precision of four characters.
plot_geohash_grid(4,
                  polygon=pyinterp.GeoHash.from_string('dds').bounding_box())
The GeoHash class allows encoding a coordinate
into a GeoHash code in order to examine its properties: precision, number of
bits, code, coordinates of the grid cell, etc.
code = ds00)
precision = 4
number of bits = 20
lon/lat = (-67.3242, 22.5879)
You can also use this class to get the neighboring GeoHash codes of this instance.
[str(item) for item in code.neighbors()]

# On the other hand, when you want to encode a large volume of data, you should
# use functions that work on numpy arrays.
['ds01', 'ds03', 'ds02', 'debr', 'debp', 'd7zz', 'dkpb', 'dkpc']
Encoding coordinates
Generation of dummy data
SIZE = 1000000
generator = numpy.random.Generator(numpy.random.PCG64(0))
lon = generator.uniform(-180, 180, SIZE)
lat = generator.uniform(-80, 80, SIZE)
measures = generator.random(SIZE)
Encoding the data
[b'mng5' b'fhv0' b'87d7' ... b'9hfj' b'3yvj' b'5ghs']
This algorithm is very fast, which makes it possible to process a lot of data quickly.
timeit.timeit('pyinterp.geohash.encode(lon, lat)',
              number=50,
              globals={
                  'pyinterp': pyinterp,
                  'lon': lon,
                  'lat': lat
              }) / 50
0.027980169160000515
The inverse operation is also possible.
You can also use the pyinterp.geohash.transform() to transform
coordinates from one précision to another.
[b'0' b'1' b'2' b'3' b'4' b'5' b'6' b'7' b'8' b'9' b'b' b'c' b'd' b'e'
 b'f' b'g' b'h' b'j' b'k' b'm' b'n' b'p' b'q' b'r' b's' b't' b'u' b'v'
 b'w' b'x' b'y' b'z']
[b'000' b'001' b'004' ... b'zzv' b'zzy' b'zzz']
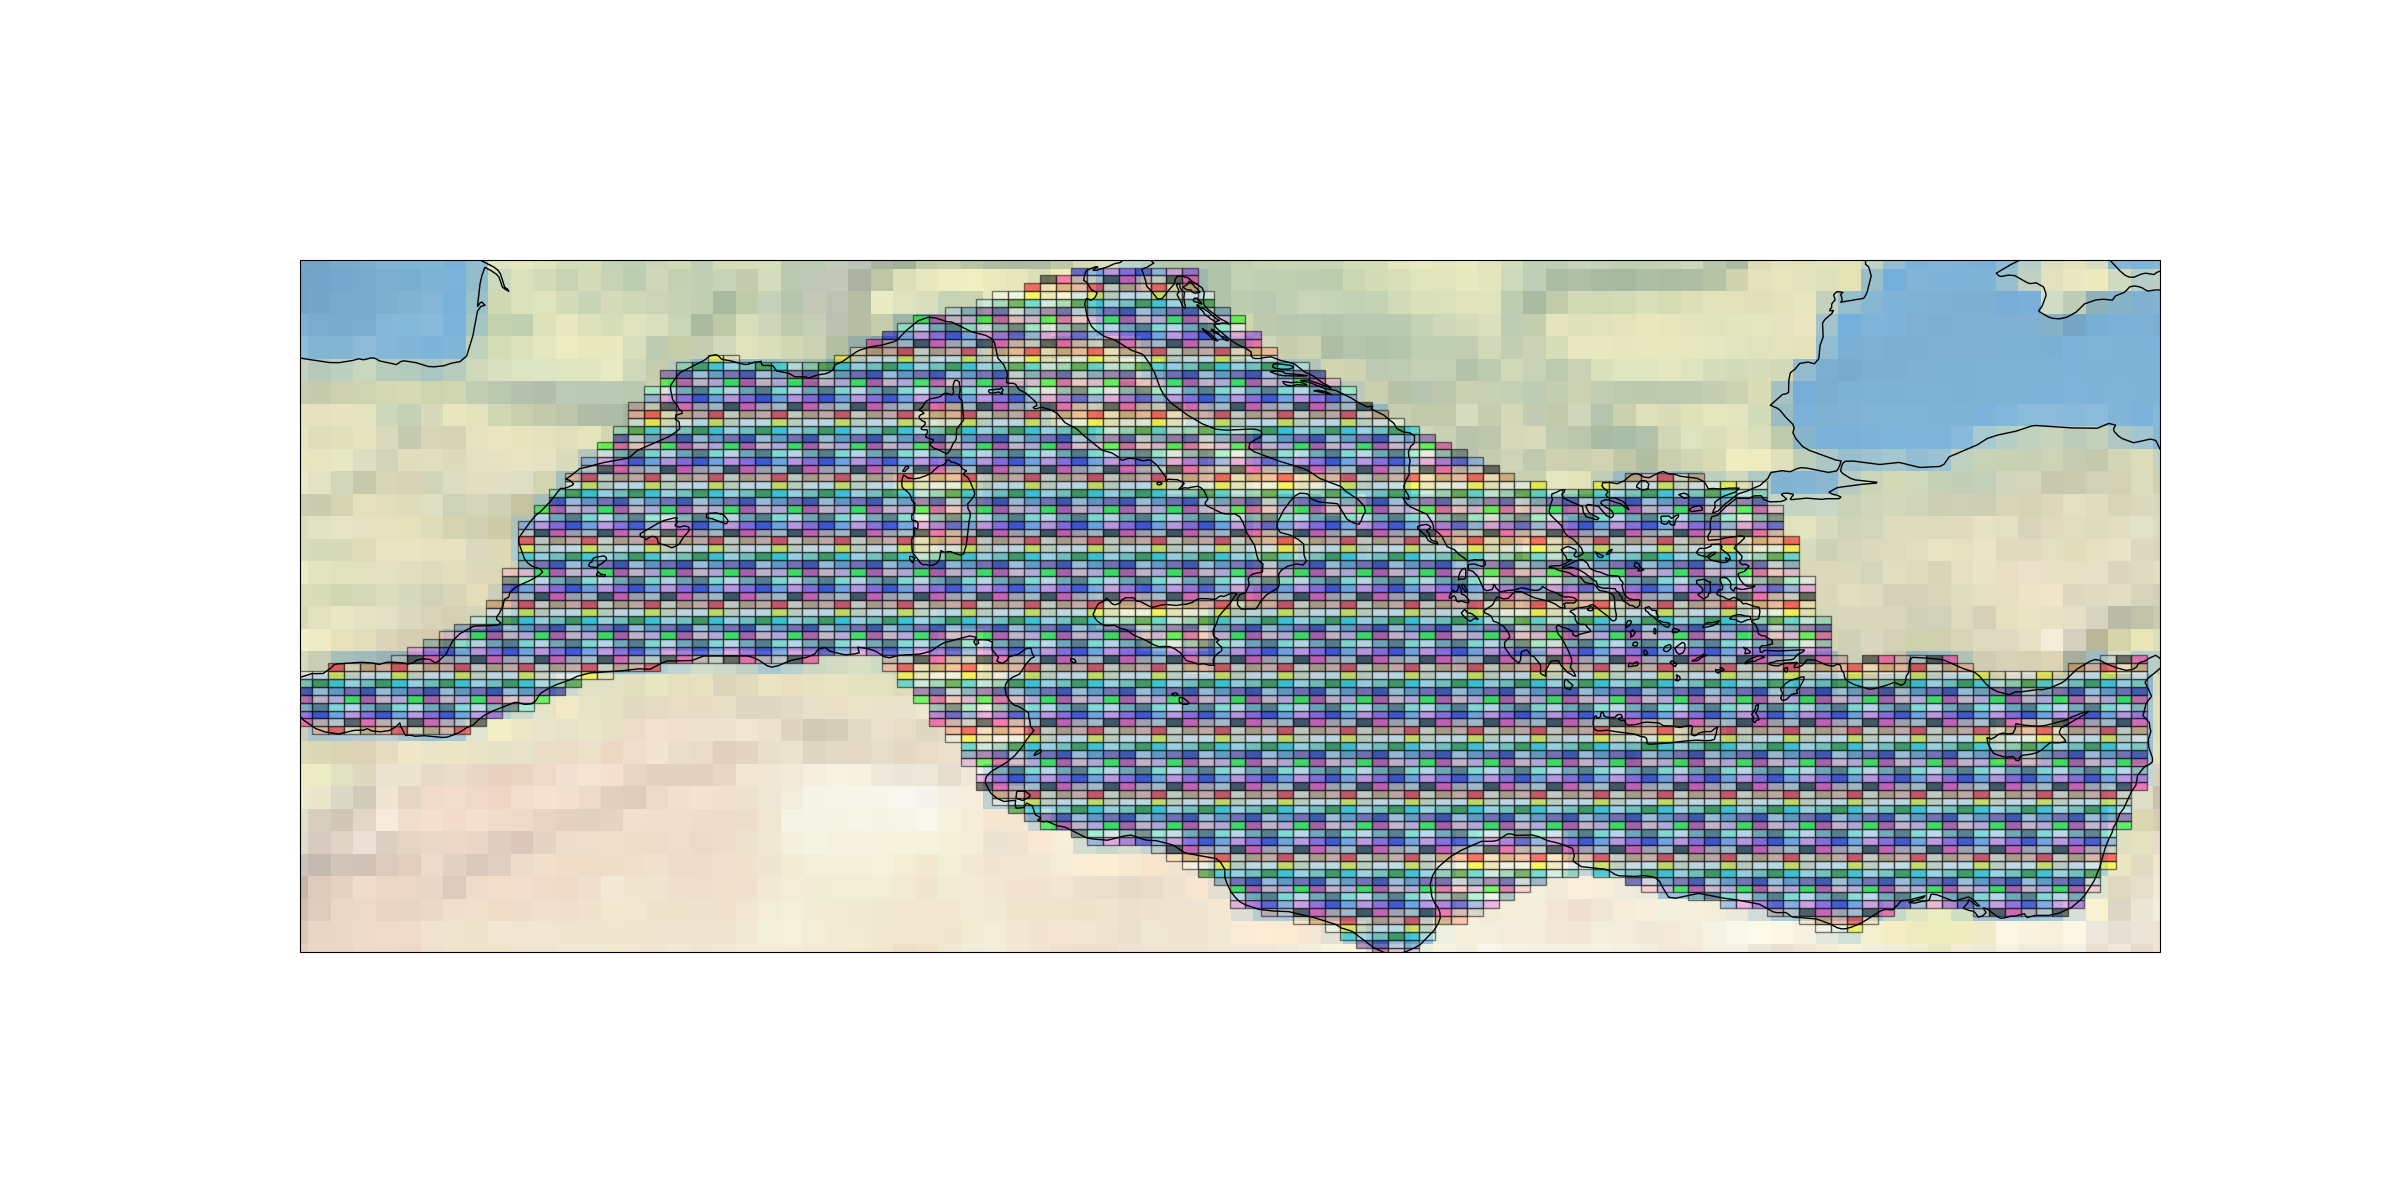
The pyinterp.geohash.bounding_boxes() function allows calculating the
GeoHash codes contained in a box or a polygon. This function allows,
for example, to obtain all the GeoHash codes present on the Mediterranean.
MEDITERRANEAN_SEA = [(-1.43504, 35.38124), (-1.68901, 35.18381),
                     (-1.93947, 35.18664), (-2.18994, 35.18945),
                     (-2.44041, 35.19223), (-2.69089, 35.19498),
                     (-3.19185, 35.20043), (-3.44234, 35.20312),
                     (-4.19382, 35.21103), (-4.44432, 35.21363),
                     (-4.69483, 35.21619), (-4.94221, 35.42047),
                     (-5.18954, 35.62438), (-5.18619, 35.82515),
                     (-5.18272, 36.02538), (-5.17911, 36.22509),
                     (-4.92467, 36.42114), (-4.41929, 36.61311),
                     (-4.16856, 36.60978), (-3.91785, 36.60641),
                     (-3.66714, 36.60302), (-3.41643, 36.59959),
                     (-1.64252, 37.35734), (-0.61682, 38.11193),
                     (-0.05974, 39.61617), (-0.05188, 39.80296),
                     (0.47608, 40.34624), (1.0068, 40.88237),
                     (1.26823, 41.05687), (3.17405, 43.12814),
                     (3.95946, 43.44167), (4.21176, 43.4303),
                     (4.46402, 43.41885), (5.4578, 43.20103),
                     (7.00043, 43.46998), (7.2684, 43.62615),
                     (8.32692, 44.07445), (8.59664, 44.22593),
                     (8.86679, 44.37629), (9.11878, 44.36187),
                     (12.30323, 45.45208), (12.82897, 45.57254),
                     (13.35502, 45.69103), (13.60653, 45.6726),
                     (14.56628, 45.29165), (14.77339, 44.96545),
                     (16.35039, 43.4468), (16.83351, 43.25904),
                     (17.31681, 43.07169), (18.26742, 42.54036),
                     (18.50146, 42.36803), (18.73581, 42.19562),
                     (19.45557, 41.83742), (22.59567, 40.39801),
                     (23.86967, 40.66103), (24.38198, 40.79528),
                     (25.14395, 40.91539), (25.39346, 40.90312),
                     (25.87922, 40.72341), (27.3756, 40.65146),
                     (27.3629, 40.4972), (27.35049, 40.34214),
                     (28.89327, 36.67855), (30.6478, 36.80647),
                     (30.89745, 36.80017), (31.14709, 36.79388),
                     (31.63983, 36.61137), (32.1328, 36.42873),
                     (34.38535, 36.54538), (34.64117, 36.70704),
                     (34.89068, 36.70094), (35.89499, 36.84229),
                     (36.14443, 36.83607), (36.13812, 36.67067),
                     (35.84461, 35.31519), (35.83989, 35.14037),
                     (35.83535, 34.96453), (35.83096, 34.78764),
                     (35.82673, 34.60973), (35.82266, 34.43077),
                     (35.56521, 34.07323), (35.30493, 33.52656),
                     (35.04582, 32.96983), (34.78535, 32.21131),
                     (34.53086, 31.82665), (34.27678, 31.43758),
                     (34.02492, 31.24227), (33.77499, 31.24401),
                     (33.52506, 31.24576), (33.27513, 31.24751),
                     (33.02519, 31.24927), (32.77526, 31.25102),
                     (32.52532, 31.25279), (32.27538, 31.25455),
                     (30.52777, 31.46553), (29.27227, 30.87518),
                     (29.0223, 30.87679), (28.27422, 31.08288),
                     (27.52624, 31.28865), (26.5284, 31.49606),
                     (25.53067, 31.70343), (25.28069, 31.70546),
                     (24.03548, 32.11364), (23.28805, 32.31846),
                     (20.02259, 30.93524), (19.77083, 30.7316),
                     (19.51917, 30.52699), (19.26761, 30.32143),
                     (19.01759, 30.32277), (18.51909, 30.5327),
                     (17.77237, 30.94967), (17.0241, 31.15993),
                     (16.02586, 31.37173), (15.77581, 31.37348),
                     (15.52992, 31.78362), (13.79181, 32.80886),
                     (12.7914, 32.81862), (12.54129, 32.82104),
                     (12.04387, 33.02684), (11.54655, 33.23236),
                     (10.30532, 33.84446), (10.05858, 34.04584),
                     (10.06218, 34.24361), (7.87667, 36.9875),
                     (7.12516, 37.00275), (6.87464, 37.00779),
                     (5.86671, 36.83664), (5.61618, 36.84139),
                     (5.36563, 36.84612), (5.11508, 36.85081),
                     (4.86453, 36.85549), (3.61163, 36.87846),
                     (2.60396, 36.70273), (2.35336, 36.70699),
                     (1.34599, 36.52884), (0.07965, 35.95831),
                     (-0.67601, 35.77038), (-1.43504, 35.38124)]
polygon = pyinterp.geodetic.Polygon(
    [pyinterp.geodetic.Point(lon, lat) for lon, lat in MEDITERRANEAN_SEA])
Density calculation
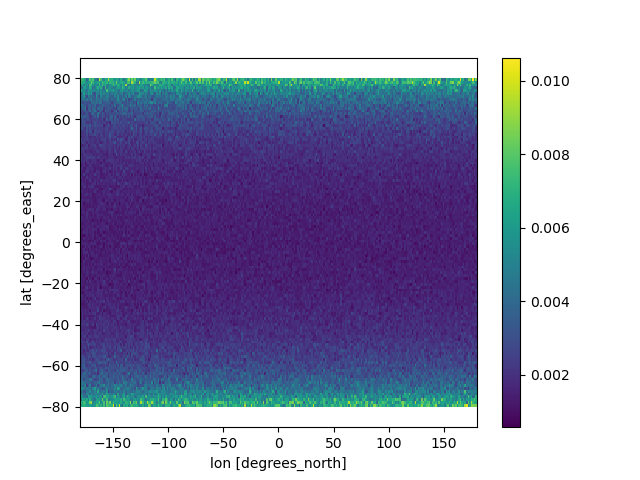
df = pandas.DataFrame({
    'lon': lon,
    'lat': lat,
    'measures': measures,
    'geohash': pyinterp.geohash.encode(lon, lat, precision=3)
})
df.set_index('geohash', inplace=True)
df = df.groupby('geohash').count()['measures'].rename('count').to_frame()
df['density'] = df['count'] / (
    pyinterp.geohash.area(df.index.values.astype('S')) / 1e6)
array = pyinterp.geohash.to_xarray(df.index.values.astype('S'), df.density)
array = array.where(array != 0, numpy.nan)

fig = matplotlib.pyplot.figure()
ax = fig.add_subplot(111)
_ = array.plot(ax=ax)
Total running time of the script: (0 minutes 4.787 seconds)