Note
Go to the end to download the full example code. or to run this example in your browser via Binder
Fill NaN values
The undefined values in the grids do not allow interpolation of values located in the neighborhood. This behavior is a concern when you need to interpolate values near the land/sea mask of some maps.
import cartopy.crs
import cartopy.feature
import matplotlib.pyplot
import numpy

import pyinterp.backends.xarray
# Module that handles the filling of undefined values.
import pyinterp.fill
import pyinterp.tests
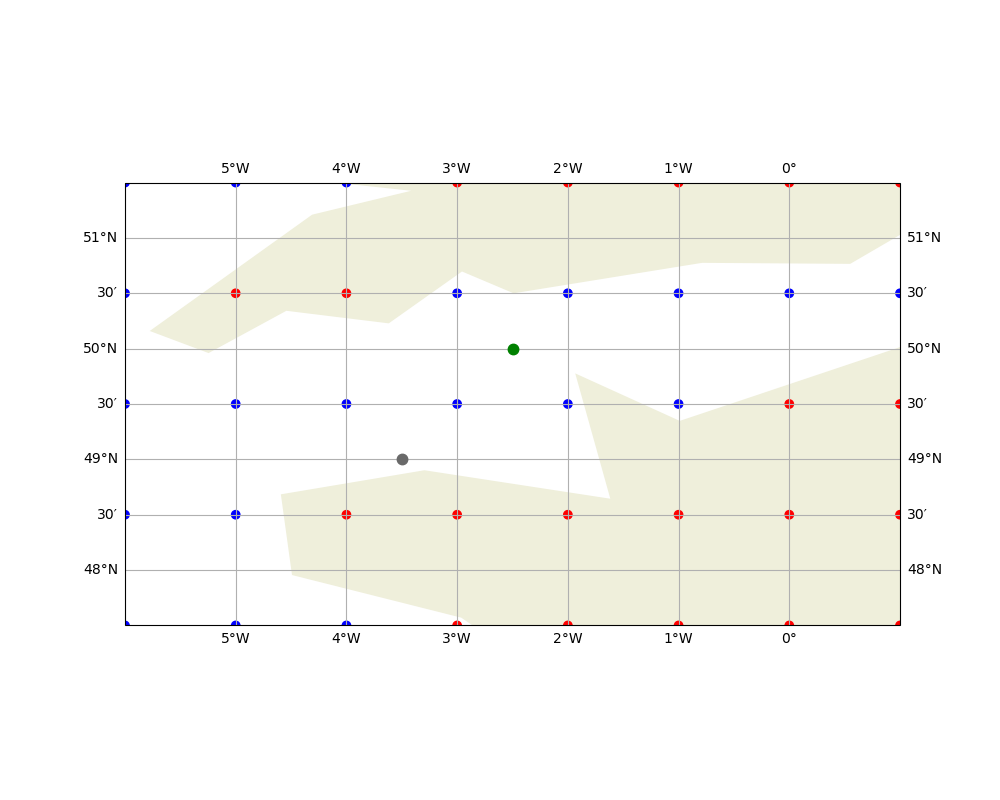
For example, in the figure above, if you want to interpolate the gray point with a bilinear interpolation, the undefined red value, set to NaN, will not allow its calculation (the result of the arithmetic operation using a value equal to NaN is NaN). On the other hand, the green point can be interpolated normally because the 4 surrounding points are defined.
fig = matplotlib.pyplot.figure(figsize=(10, 8))
ax = fig.add_subplot(111, projection=cartopy.crs.PlateCarree())
ax.set_extent([-6, 1, 47.5, 51.5], crs=cartopy.crs.PlateCarree())
ax.add_feature(cartopy.feature.LAND.with_scale('110m'))
ax.gridlines(draw_labels=True, dms=True, x_inline=False, y_inline=False)

lons, lats = numpy.meshgrid(numpy.arange(-6, 2),
                            numpy.arange(47.5, 52.5),
                            indexing='ij')
mask = numpy.array([
    [1, 1, 1, 0, 0, 0, 0, 0],  # yapf: disable
    [1, 1, 0, 0, 0, 0, 0, 0],  # yapf: disable
    [1, 1, 1, 1, 1, 1, 0, 0],  # yapf: disable
    [1, 0, 0, 1, 1, 1, 1, 1],  # yapf: disable
    [1, 1, 1, 0, 0, 0, 0, 0]
]).T
ax.scatter(lons.ravel(),
           lats.ravel(),
           c=mask,
           cmap='bwr_r',
           transform=cartopy.crs.PlateCarree(),
           vmin=0,
           vmax=1)
ax.plot([-3.5], [49], linestyle='', marker='.', color='dimgray', markersize=15)
ax.plot([-2.5], [50], linestyle='', marker='.', color='green', markersize=15)
fig.show()

To overcome this problem, the library provides methods to fill undefined values.
Note
In the case of an interpolation of the nearest neighbor the undefined values have no impact because no arithmetic operation is done on the grid values: we just return the value of the nearest point.
LOESS
The first method applies a weighted local
regression to extrapolate the boundary between defined and undefined values.
The user must indicate the number of pixels on the X and Y axes to be
considered in the calculation.
Let’s start by building the object handling our grid.
The function filling the holes near the mask is called
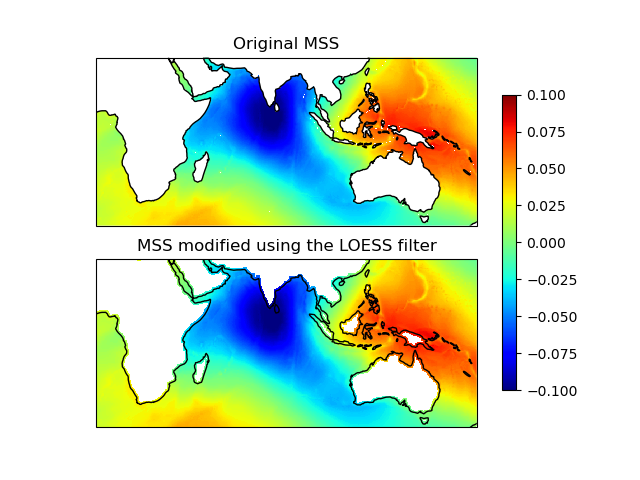
filled = pyinterp.fill.loess(grid, nx=3, ny=3)
The image below illustrates the result:
fig = matplotlib.pyplot.figure()
ax1 = fig.add_subplot(
    211, projection=cartopy.crs.PlateCarree(central_longitude=180))
lons, lats = numpy.meshgrid(grid.x, grid.y, indexing='ij')
pcm = ax1.pcolormesh(lons,
                     lats,
                     ds.mss.T,
                     cmap='jet',
                     shading='auto',
                     transform=cartopy.crs.PlateCarree(),
                     vmin=-0.1,
                     vmax=0.1)
ax1.coastlines()
ax1.set_title('Original MSS')
ax1.set_extent([0, 170, -45, 30], crs=cartopy.crs.PlateCarree())
ax2 = fig.add_subplot(
    212, projection=cartopy.crs.PlateCarree(central_longitude=180))
pcm = ax2.pcolormesh(lons,
                     lats,
                     filled,
                     cmap='jet',
                     shading='auto',
                     transform=cartopy.crs.PlateCarree(),
                     vmin=-0.1,
                     vmax=0.1)
ax2.coastlines()
ax2.set_title('MSS modified using the LOESS filter')
ax2.set_extent([0, 170, -45, 30], crs=cartopy.crs.PlateCarree())
fig.colorbar(pcm, ax=[ax1, ax2], shrink=0.8)
fig.show()

Gauss-Seidel
The second method consists of
replacing all undefined values (NaN) in a grid using the Gauss-Seidel method
by relaxation. This link contains more
information on the method used.
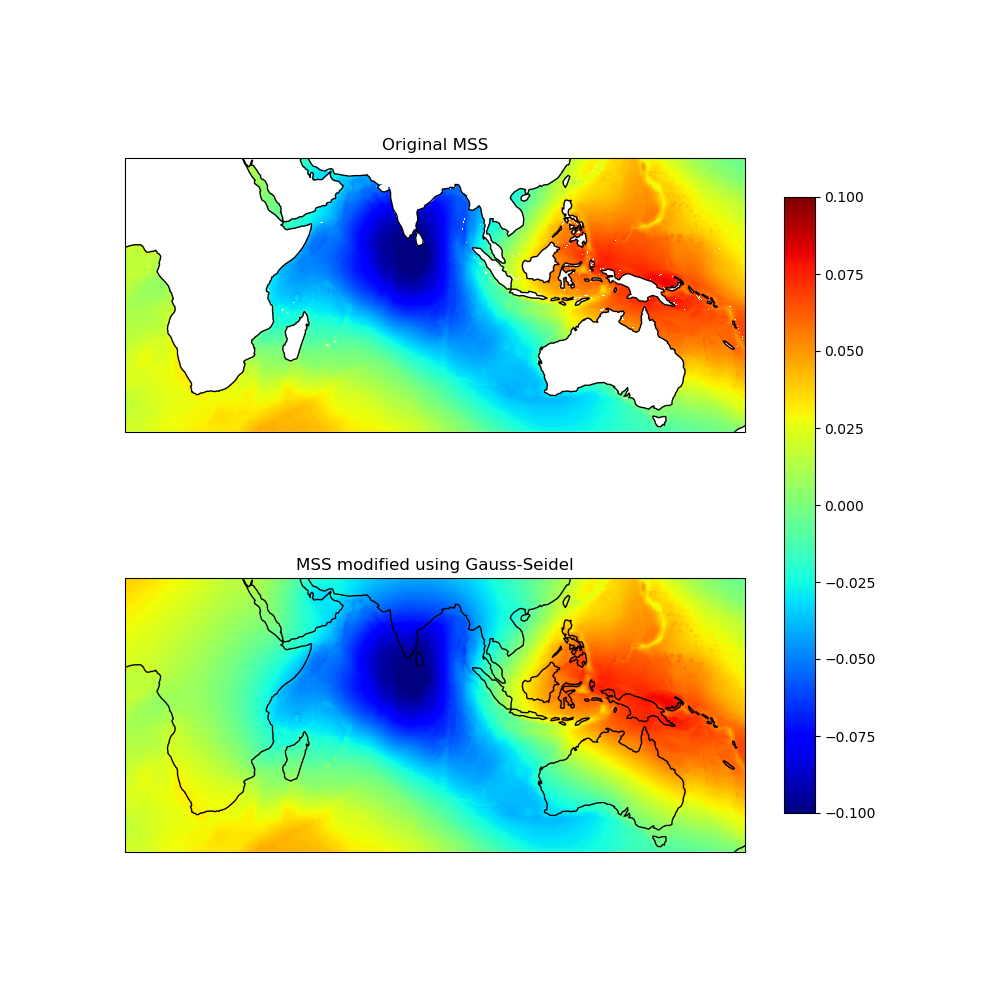
has_converged, filled = pyinterp.fill.gauss_seidel(grid)
The image below illustrates the result:
fig = matplotlib.pyplot.figure(figsize=(10, 10))
ax1 = fig.add_subplot(
    211, projection=cartopy.crs.PlateCarree(central_longitude=180))
pcm = ax1.pcolormesh(lons,
                     lats,
                     ds.mss.T,
                     cmap='jet',
                     shading='auto',
                     transform=cartopy.crs.PlateCarree(),
                     vmin=-0.1,
                     vmax=0.1)
ax1.coastlines()
ax1.set_title('Original MSS')
ax1.set_extent([0, 170, -45, 30], crs=cartopy.crs.PlateCarree())
ax2 = fig.add_subplot(
    212, projection=cartopy.crs.PlateCarree(central_longitude=180))
pcm = ax2.pcolormesh(lons,
                     lats,
                     filled,
                     cmap='jet',
                     shading='auto',
                     transform=cartopy.crs.PlateCarree(),
                     vmin=-0.1,
                     vmax=0.1)
ax2.coastlines()
ax2.set_title('MSS modified using Gauss-Seidel')
ax2.set_extent([0, 170, -45, 30], crs=cartopy.crs.PlateCarree())
fig.colorbar(pcm, ax=[ax1, ax2], shrink=0.8)
fig.show()

Total running time of the script: (0 minutes 8.397 seconds)