Note
Go to the end to download the full example code or to run this example in your browser via Binder.
Mesh Interpolation#
This example demonstrates how to interpolate a tidal model stored in a mesh using LGP2 discretization.
Note
This is a low-level example that demonstrates direct interaction with the
C++ core classes for model interpolation. For standard use cases, it is
recommended to use the high-level pyfes.evaluate_tide() function
with a configuration file, as shown in Prediction example.
First, we import the required modules.
from __future__ import annotations

import pathlib

import cartopy.crs
import matplotlib.pyplot
import netCDF4
import numpy

import pyfes
MODEL = str(
    pathlib.Path().absolute().parent
    / 'tests'
    / 'python'
    / 'dataset'
    / 'fes_2014.nc'
)
Create a function to load one wave from the model.
def load_model(
    model: str,
    wave: str,
    max_distance: float = 0.0,
) -> pyfes.core.tidal_model.LGP2Complex64:
    """Load a tidal wave model from a netCDF file.

    Args:
        model: Path to the netCDF file.
        wave: Name of the wave to load.
        max_distance: Maximum distance allowed to extrapolate the model if the
            requested point is outside the domain.

    Returns:
        The tidal wave model.

    """
    with netCDF4.Dataset(model, 'r') as ds:
        lon = ds.variables['lon'][:]
        lat = ds.variables['lat'][:]
        triangle = ds.variables['triangle'][:]
        code = ds.variables['lgp2'][:]

        amp = numpy.ma.filled(ds.variables[f'{wave}_amp'][:], numpy.nan)
        pha = numpy.ma.filled(ds.variables[f'{wave}_phase'][:], numpy.nan)
        pha = numpy.radians(pha)
        values = amp * numpy.exp(1j * pha)

        result = pyfes.core.tidal_model.LGP2Complex64(
            pyfes.core.mesh.Index(lon, lat, triangle),
            codes=code,
            tide_type=pyfes.TIDE,
            max_distance=max_distance,
        )
        result.add_constituent(wave, values)
        return result
Load the model.
model = load_model(MODEL, 'M2')
Create a grid to interpolate the model. For this example, we use a regular grid over the French coast.
lon, lat = numpy.meshgrid(
    numpy.linspace(-5.0, 10.0, 100),
    numpy.linspace(40.0, 55.0, 100),
)
Interpolate the waves loaded from the model.
Values is a dictionary of numpy arrays. Each key is the name of a wave and the value is the interpolated values. Quality is a numpy array of integers. The value is positive if the point is interpolated, negative if the point is extrapolated with the nearest vertices and zero if the point is outside the domain.
print(values)
{'M2': array([       nan+0.j        ,        nan+0.j        ,
              nan+0.j        , ..., 1.49191174+2.69202328j,
       1.41529033+2.70197051j, 1.42119329+2.63657205j], shape=(10000,))}
Calculate the amplitude of the M2 wave interpolated on the grid.
grid = values['M2']
grid = numpy.ma.masked_invalid(grid)
grid = grid.reshape(lon.shape)
grid = numpy.absolute(grid)
Plot the result.
fig = matplotlib.pyplot.figure(figsize=(10, 10))
ax = fig.add_subplot(1, 1, 1, projection=cartopy.crs.PlateCarree())
ax.set_extent([-5.0, 10.0, 40.0, 55.0], crs=cartopy.crs.PlateCarree())
ax.coastlines()
contour = ax.pcolormesh(
    lon,
    lat,
    grid,
    transform=cartopy.crs.PlateCarree(),
    cmap='terrain',
    vmin=0.0,
    vmax=400.0,
)
cbar = matplotlib.pyplot.colorbar(contour, ax=ax, orientation='vertical')
cbar.set_label('Amplitude (cm)')
matplotlib.pyplot.show()
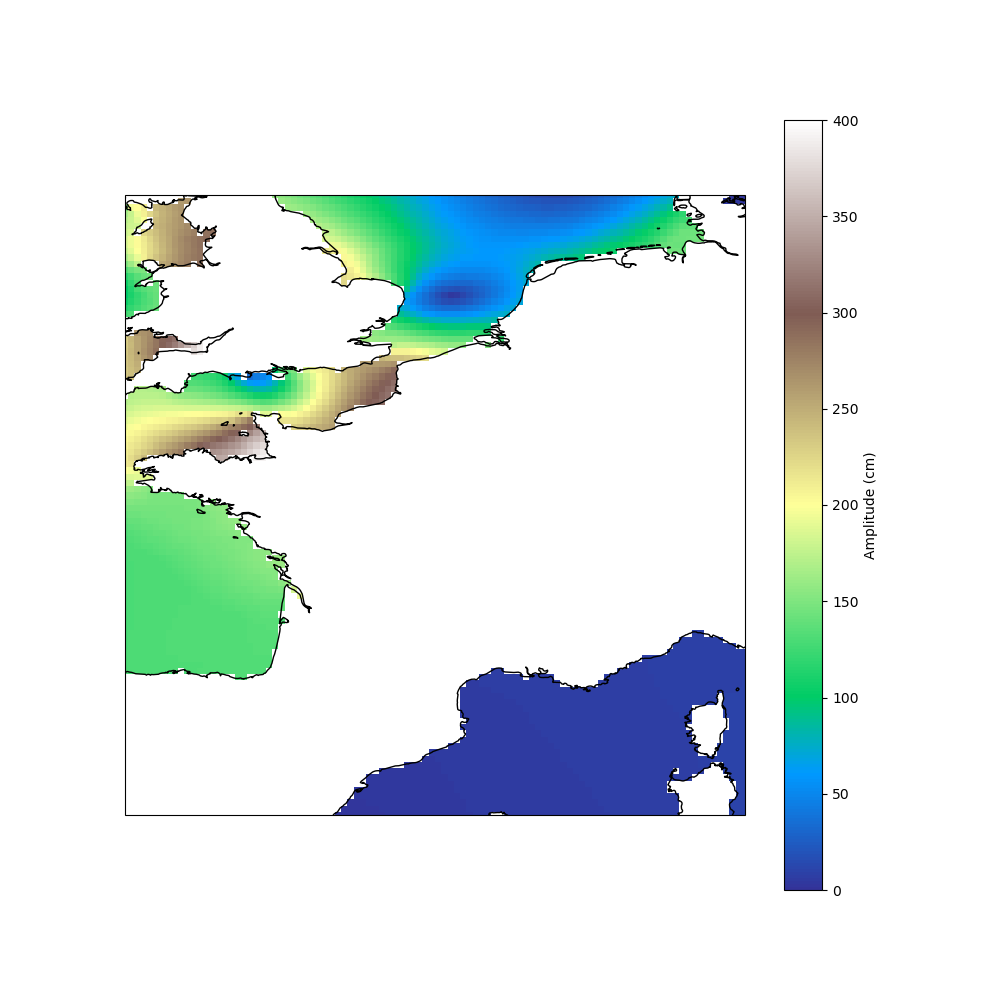
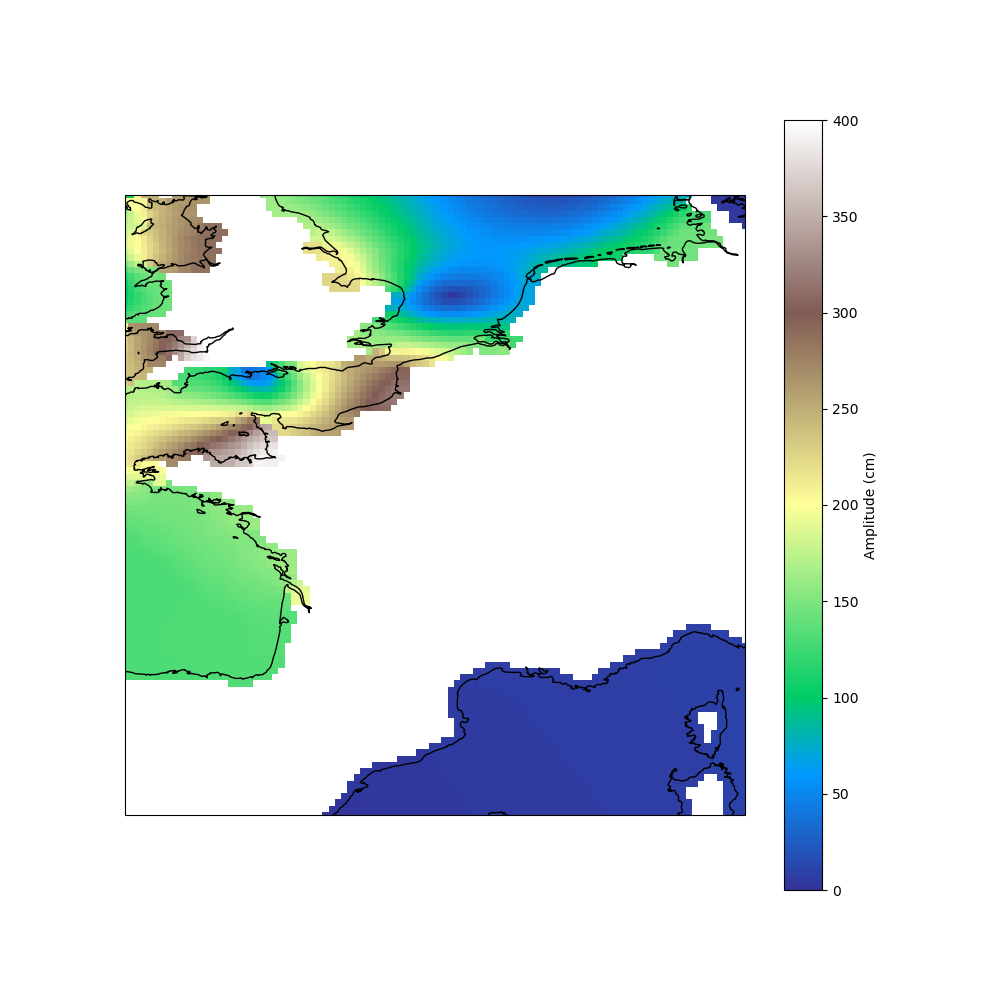
The values near the coast are not interpolated because they are outside the
model’s domain. It is possible to extrapolate the model by increasing the
max_distance parameter. For example, setting it to 20 km allows
extrapolation into the English Channel.
Note
The max_distance parameter is only used for extrapolation. If the point is inside the domain, the model is always interpolated. The distance is calculated on the sphere. The expected unit is meters.
Plot the result.
fig = matplotlib.pyplot.figure(figsize=(10, 10))
ax = fig.add_subplot(1, 1, 1, projection=cartopy.crs.PlateCarree())
ax.set_extent([-5.0, 10.0, 40.0, 55.0], crs=cartopy.crs.PlateCarree())
ax.coastlines()
contour = ax.pcolormesh(
    lon,
    lat,
    grid,
    transform=cartopy.crs.PlateCarree(),
    cmap='terrain',
    vmin=0.0,
    vmax=400.0,
)
cbar = matplotlib.pyplot.colorbar(contour, ax=ax, orientation='vertical')
cbar.set_label('Amplitude (cm)')
matplotlib.pyplot.show()
Total running time of the script: (0 minutes 3.293 seconds)