

Note
Go to the end to download the full example code or to run this example in your browser via Binder.
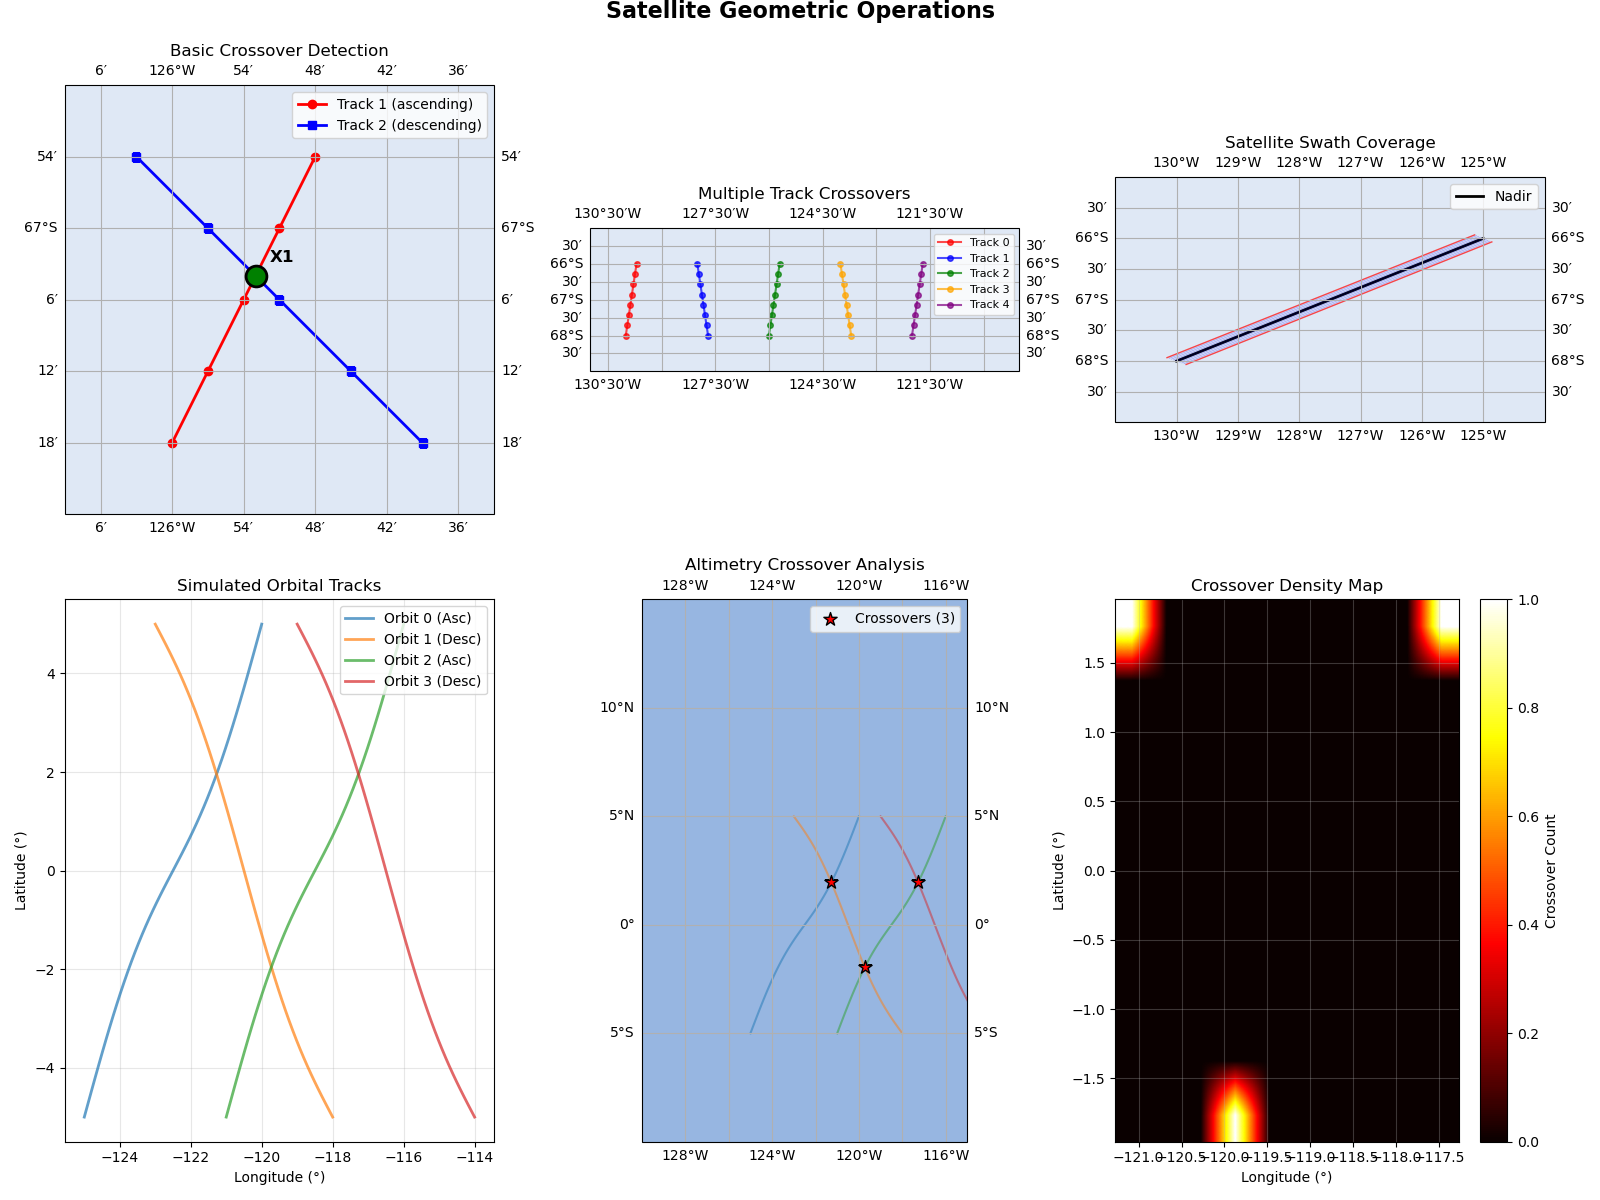
Satellite-Specific Geometric Operations#
This example demonstrates the satellite-specific geometric operations available
in the pyinterp.geometry.satellite module. These functions are particularly
useful for satellite altimetry, remote sensing, and other applications involving
satellite ground tracks.
Operations Covered:
find_crossovers(): Find intersectionpoints between satellite tracks
calculate_swath(): Calculate satelliteswath coverage
Common Applications:
Satellite altimetry crossover analysis
Orbit track intersection detection
Swath coverage calculation
Multi-satellite coordination
Calibration and validation studies
Let’s start by importing the necessary libraries.
import cartopy.crs
import cartopy.feature
import matplotlib.pyplot
import numpy
from pyinterp.geometry import geographic, satellite
Setup: Reference Spheroid#
wgs84 = geographic.Spheroid()
Crossover Detection: Basic Example#
The find_crossovers() function finds
intersection points between two satellite tracks. This is crucial for
satellite altimetry where you need to find where two satellite passes
intersect for calibration and validation.
# Create two crossing satellite tracks
# Track 1: ascending pass
lon1 = numpy.array(
    [234.00, 234.05, 234.10, 234.15, 234.20], dtype=numpy.float64
)
lat1 = numpy.array(
    [-67.30, -67.20, -67.10, -67.00, -66.90], dtype=numpy.float64
)

# Track 2: descending pass that crosses track 1
lon2 = numpy.array(
    [233.95, 234.05, 234.15, 234.25, 234.35], dtype=numpy.float64
)
lat2 = numpy.array(
    [-66.90, -67.00, -67.10, -67.20, -67.30], dtype=numpy.float64
)

print("Track Information:")
print(f"  Track 1: {len(lon1)} points (ascending)")
print(f"  Track 2: {len(lon2)} points (descending)")
Track Information:
  Track 1: 5 points (ascending)
  Track 2: 5 points (descending)
Find crossovers between the two tracks The predicate parameter defines the maximum distance threshold for considering a potential crossover
crossovers = satellite.find_crossovers(
    lon1,
    lat1,
    lon2,
    lat2,
    predicate=50_000,  # Maximum distance in meters
    spheroid=wgs84,
    strategy=geographic.algorithms.VINCENTY,
)

print("\nCrossover Detection:")
print(f"  Found {len(crossovers)} crossover(s)")

if crossovers:
    for i, crossover in enumerate(crossovers):
        point = crossover.point
        print(f"\n  Crossover {i + 1}:")
        print(f"    Location: ({point.lon:.6f}°, {point.lat:.6f}°)")
        print(f"    Track 1 segment index: {crossover.index1}")
        print(f"    Track 2 segment index: {crossover.index2}")

        # Calculate distances from crossover to nearby track points
        p1 = geographic.Point(lon1[crossover.index1], lat1[crossover.index1])
        p2 = geographic.Point(lon2[crossover.index2], lat2[crossover.index2])

        d1 = geographic.algorithms.distance(
            crossover.point, p1, spheroid=wgs84
        )
        d2 = geographic.algorithms.distance(
            crossover.point, p2, spheroid=wgs84
        )

        print(f"    Distance to Track 1 point: {d1:.2f} m")
        print(f"    Distance to Track 2 point: {d2:.2f} m")
Crossover Detection:
  Found 1 crossover(s)

  Crossover 1:
    Location: (-125.883333°, -67.066667°)
    Track 1 segment index: 2
    Track 2 segment index: 2
    Distance to Track 1 point: 3787.37 m
    Distance to Track 2 point: 3989.85 m
Crossover Detection: Multiple Tracks#
In real applications, you often need to find crossovers between many tracks.
# Create multiple tracks with different orientations
n_tracks = 5
tracks = []

for i in range(n_tracks):
    # Create tracks at different longitudes
    base_lon = 230.0 + i * 2.0
    lon_track = numpy.linspace(
        base_lon, base_lon + 0.3, 8, dtype=numpy.float64
    )

    # Alternate between ascending and descending
    if i % 2 == 0:
        lat_track = numpy.linspace(-68.0, -66.0, 8, dtype=numpy.float64)
    else:
        lat_track = numpy.linspace(-66.0, -68.0, 8, dtype=numpy.float64)

    tracks.append((lon_track, lat_track))

print("\nMultiple Track Analysis:")
print(f"  Total tracks: {len(tracks)}")

# Find all crossovers between all pairs of tracks
all_crossovers = []
for i in range(len(tracks)):
    for j in range(i + 1, len(tracks)):
        lon_i, lat_i = tracks[i]
        lon_j, lat_j = tracks[j]

        crossovers_ij = satellite.find_crossovers(
            lon_i,
            lat_i,
            lon_j,
            lat_j,
            predicate=50_000,
            spheroid=wgs84,
            strategy=geographic.algorithms.VINCENTY,
        )

        if crossovers_ij:
            all_crossovers.extend(
                [(i, j, crossover) for crossover in crossovers_ij]
            )

print(f"  Total crossovers found: {len(all_crossovers)}")
print("  Track pairs with crossovers:")
for i, j, crossover in all_crossovers:
    print(
        f"    Track {i} x Track {j}: "
        f"({crossover.point.lon:.4f}°, {crossover.point.lat:.4f}°)"
    )
Multiple Track Analysis:
  Total tracks: 5
  Total crossovers found: 0
  Track pairs with crossovers:
Crossover Detection: Different Strategies#
Test different geodesic strategies for crossover detection.
strategies = [
    (geographic.algorithms.ANDOYER, "ANDOYER"),
    (geographic.algorithms.THOMAS, "THOMAS"),
    (geographic.algorithms.VINCENTY, "VINCENTY"),
    (geographic.algorithms.KARNEY, "KARNEY"),
]

print("\nStrategy Comparison:")
for strategy, name in strategies:
    crossovers_strat = satellite.find_crossovers(
        lon1,
        lat1,
        lon2,
        lat2,
        predicate=50_000,
        spheroid=wgs84,
        strategy=strategy,
    )

    if crossovers_strat:
        point = crossovers_strat[0].point
        print(
            f"  {name:10s}: ({point.lon:.8f}°, {point.lat:.8f}°) "
            f"- {len(crossovers_strat)} crossover(s)"
        )
Strategy Comparison:
  ANDOYER   : (-125.88333333°, -67.06666667°) - 1 crossover(s)
  THOMAS    : (-125.88333333°, -67.06666667°) - 1 crossover(s)
  VINCENTY  : (-125.88333333°, -67.06666667°) - 1 crossover(s)
  KARNEY    : (-125.88333333°, -67.06666667°) - 1 crossover(s)
Swath Calculation#
The calculate_swath() function
calculates the ground coverage (swath) of a satellite sensor.
# Create a nadir track (center line of satellite ground track)
lon_nadir = numpy.linspace(230.0, 235.0, 20, dtype=numpy.float64)
lat_nadir = numpy.linspace(-68.0, -66.0, 20, dtype=numpy.float64)

# Swath parameters
delta_ac = 2000.0  # Along-track spacing in meters
half_gap = 1000.0  # Half-gap between nadir and swath edge in meters
half_swath = 5  # Number of points on each side of nadir

# Calculate swath
lon_swath, lat_swath = satellite.calculate_swath(
    lon_nadir,
    lat_nadir,
    delta_ac,
    half_gap,
    half_swath,
    spheroid=wgs84,
)

print("\nSwath Calculation:")
print(f"  Nadir track points: {len(lon_nadir)}")
print(f"  Swath width (points): {2 * half_swath + 1}")
print(f"  Along-track spacing: {delta_ac} m")
print(f"  Half-gap: {half_gap} m")
print(f"  Output shape: {lon_swath.shape}")
Swath Calculation:
  Nadir track points: 20
  Swath width (points): 11
  Along-track spacing: 2000.0 m
  Half-gap: 1000.0 m
  Output shape: (20, 10)
Real-World Example: Satellite Altimetry Crossover Analysis#
Simulate a realistic satellite altimetry scenario with multiple orbits.
# Create realistic orbital tracks (simplified)
def create_orbit_track(
    start_lon: float,
    start_lat: float,
    n_points: int = 50,
    ascending: bool = True,
) -> tuple[numpy.ndarray, numpy.ndarray]:
    """Create a simplified satellite orbit track."""
    lons = numpy.linspace(
        start_lon, start_lon + 5.0, n_points, dtype=numpy.float64
    )

    if ascending:
        lats = numpy.linspace(
            start_lat, start_lat + 10.0, n_points, dtype=numpy.float64
        )
    else:
        lats = numpy.linspace(
            start_lat, start_lat - 10.0, n_points, dtype=numpy.float64
        )

    # Add slight sinusoidal variation to simulate orbital precession
    lats += 0.5 * numpy.sin(numpy.linspace(0, 2 * numpy.pi, n_points))

    return lons, lats


# Create multiple orbital passes
orbits = [
    create_orbit_track(-125.0, -5.0, ascending=True),
    create_orbit_track(-123.0, 5.0, ascending=False),
    create_orbit_track(-121.0, -5.0, ascending=True),
    create_orbit_track(-119.0, 5.0, ascending=False),
]

print("\nSatellite Altimetry Simulation:")
print(f"  Number of orbits: {len(orbits)}")

# Find all crossovers
orbit_crossovers = []
for i in range(len(orbits)):
    for j in range(i + 1, len(orbits)):
        lon_i, lat_i = orbits[i]
        lon_j, lat_j = orbits[j]

        crossovers_ij = satellite.find_crossovers(
            lon_i,
            lat_i,
            lon_j,
            lat_j,
            predicate=100_000,  # 100 km threshold
            allow_multiple=True,
            spheroid=wgs84,
            strategy=geographic.algorithms.VINCENTY,
        )

        orbit_crossovers.extend(
            [(i, j, crossover) for crossover in crossovers_ij]
        )

print(f"  Total crossovers: {len(orbit_crossovers)}")

# Analyze crossover locations
if orbit_crossovers:
    crossover_lons = [c[2].point.lon for c in orbit_crossovers]
    crossover_lats = [c[2].point.lat for c in orbit_crossovers]

    print("\nCrossover Statistics:")
    print(
        f"  Longitude range: [{min(crossover_lons):.2f}°, "
        f"{max(crossover_lons):.2f}°]"
    )
    print(
        f"  Latitude range: [{min(crossover_lats):.2f}°, "
        f"{max(crossover_lats):.2f}°]"
    )
Satellite Altimetry Simulation:
  Number of orbits: 4
  Total crossovers: 3

Crossover Statistics:
  Longitude range: [-121.27°, -117.27°]
  Latitude range: [-1.96°, 1.96°]
Visualization: Satellite Track Crossovers#
fig = matplotlib.pyplot.figure(figsize=(16, 12))

# Plot 1: Basic crossover detection
ax1 = fig.add_subplot(2, 3, 1, projection=cartopy.crs.PlateCarree())
ax1.add_feature(cartopy.feature.LAND, alpha=0.3)
ax1.add_feature(cartopy.feature.OCEAN, alpha=0.3)

# Plot tracks
ax1.plot(
    lon1,
    lat1,
    "-o",
    color="red",
    linewidth=2,
    markersize=6,
    label="Track 1 (ascending)",
    transform=cartopy.crs.Geodetic(),
)
ax1.plot(
    lon2,
    lat2,
    "-s",
    color="blue",
    linewidth=2,
    markersize=6,
    label="Track 2 (descending)",
    transform=cartopy.crs.Geodetic(),
)

# Plot crossovers
if crossovers:
    for i, crossover in enumerate(crossovers):
        ax1.plot(
            crossover.point.lon,
            crossover.point.lat,
            "o",
            color="green",
            markersize=15,
            markeredgecolor="black",
            markeredgewidth=2,
            transform=cartopy.crs.PlateCarree(),
            zorder=10,
        )
        ax1.text(
            crossover.point.lon + 0.02,
            crossover.point.lat + 0.02,
            f"X{i + 1}",
            fontsize=12,
            fontweight="bold",
            transform=cartopy.crs.PlateCarree(),
        )

ax1.set_extent(
    [
        min(lon1.min(), lon2.min()) - 0.1,
        max(lon1.max(), lon2.max()) + 0.1,
        min(lat1.min(), lat2.min()) - 0.1,
        max(lat1.max(), lat2.max()) + 0.1,
    ]
)
ax1.gridlines(draw_labels=True, dms=True, x_inline=False, y_inline=False)
ax1.legend(loc="upper right")
ax1.set_title("Basic Crossover Detection")

# Plot 2: Multiple tracks
ax2 = fig.add_subplot(2, 3, 2, projection=cartopy.crs.PlateCarree())
ax2.add_feature(cartopy.feature.LAND, alpha=0.3)
ax2.add_feature(cartopy.feature.OCEAN, alpha=0.3)

# Plot all tracks
colors = ["red", "blue", "green", "orange", "purple"]
for i, (lon_t, lat_t) in enumerate(tracks):
    ax2.plot(
        lon_t,
        lat_t,
        "-o",
        color=colors[i % len(colors)],
        linewidth=1.5,
        markersize=4,
        label=f"Track {i}",
        transform=cartopy.crs.Geodetic(),
        alpha=0.7,
    )

# Plot crossovers
for _i, _j, crossover in all_crossovers:
    ax2.plot(
        crossover.point.lon,
        crossover.point.lat,
        "*",
        color="yellow",
        markersize=12,
        markeredgecolor="black",
        markeredgewidth=1,
        transform=cartopy.crs.PlateCarree(),
        zorder=10,
    )

ax2.set_extent([229, 241, -69, -65])
ax2.gridlines(draw_labels=True, dms=True, x_inline=False, y_inline=False)
ax2.legend(loc="upper right", fontsize=8)
ax2.set_title("Multiple Track Crossovers")

# Plot 3: Swath coverage
ax3 = fig.add_subplot(2, 3, 3, projection=cartopy.crs.PlateCarree())
ax3.add_feature(cartopy.feature.LAND, alpha=0.3)
ax3.add_feature(cartopy.feature.OCEAN, alpha=0.3)

# Plot nadir track
ax3.plot(
    lon_nadir,
    lat_nadir,
    "k-",
    linewidth=2,
    label="Nadir",
    transform=cartopy.crs.Geodetic(),
)

# Plot swath coverage
for i in range(lon_swath.shape[1]):
    if i == 0 or i == lon_swath.shape[1] - 1:
        # Edge of swath
        ax3.plot(
            lon_swath[:, i],
            lat_swath[:, i],
            "r-",
            linewidth=1,
            alpha=0.7,
            transform=cartopy.crs.Geodetic(),
        )
    else:
        # Interior swath lines
        ax3.plot(
            lon_swath[:, i],
            lat_swath[:, i],
            "b-",
            linewidth=0.5,
            alpha=0.3,
            transform=cartopy.crs.Geodetic(),
        )

ax3.set_extent([229, 236, -69, -65])
ax3.gridlines(draw_labels=True, dms=True, x_inline=False, y_inline=False)
ax3.legend()
ax3.set_title("Satellite Swath Coverage")

# Plot 4: Orbital tracks (simplified view)
ax4 = fig.add_subplot(2, 3, 4)

for i, (lon_o, lat_o) in enumerate(orbits):
    direction = "Asc" if i % 2 == 0 else "Desc"
    ax4.plot(
        lon_o,
        lat_o,
        "-",
        linewidth=2,
        label=f"Orbit {i} ({direction})",
        alpha=0.7,
    )

ax4.grid(True, alpha=0.3)
ax4.set_xlabel("Longitude (°)")
ax4.set_ylabel("Latitude (°)")
ax4.legend()
ax4.set_title("Simulated Orbital Tracks")

# Plot 5: Crossover locations map
ax5 = fig.add_subplot(2, 3, 5, projection=cartopy.crs.PlateCarree())
ax5.add_feature(cartopy.feature.LAND)
ax5.add_feature(cartopy.feature.OCEAN)
ax5.add_feature(cartopy.feature.COASTLINE)

# Plot all orbits
for lon_o, lat_o in orbits:
    ax5.plot(
        lon_o,
        lat_o,
        "-",
        linewidth=1.5,
        alpha=0.5,
        transform=cartopy.crs.Geodetic(),
    )

# Plot crossovers
if orbit_crossovers:
    crossover_lons = [c[2].point.lon for c in orbit_crossovers]
    crossover_lats = [c[2].point.lat for c in orbit_crossovers]

    ax5.scatter(
        crossover_lons,
        crossover_lats,
        c="red",
        s=100,
        marker="*",
        edgecolor="black",
        linewidth=1,
        label=f"Crossovers ({len(orbit_crossovers)})",
        transform=cartopy.crs.PlateCarree(),
        zorder=10,
    )

ax5.set_extent([-130, -115, -10, 15])
ax5.gridlines(draw_labels=True, dms=True, x_inline=False, y_inline=False)
ax5.legend()
ax5.set_title("Altimetry Crossover Analysis")

# Plot 6: Crossover density histogram
ax6 = fig.add_subplot(2, 3, 6)

if orbit_crossovers:
    # Calculate distances between consecutive crossovers
    crossover_lons = numpy.array([c[2].point.lon for c in orbit_crossovers])
    crossover_lats = numpy.array([c[2].point.lat for c in orbit_crossovers])

    # Create 2D histogram
    h, xedges, yedges = numpy.histogram2d(
        crossover_lons, crossover_lats, bins=10
    )

    extent = [xedges[0], xedges[-1], yedges[0], yedges[-1]]
    im = ax6.imshow(
        h.T,
        extent=extent,
        origin="lower",
        cmap="hot",
        aspect="auto",
        interpolation="bilinear",
    )
    matplotlib.pyplot.colorbar(im, ax=ax6, label="Crossover Count")

ax6.set_xlabel("Longitude (°)")
ax6.set_ylabel("Latitude (°)")
ax6.set_title("Crossover Density Map")
ax6.grid(True, alpha=0.3)

matplotlib.pyplot.tight_layout()
matplotlib.pyplot.suptitle(
    "Satellite Geometric Operations",
    fontsize=16,
    fontweight="bold",
    y=1.00,
)
Text(0.5, 1.0, 'Satellite Geometric Operations')
Summary and Best Practices#
print("\n" + "=" * 70)
print("SUMMARY: Satellite Geometric Operations")
print("=" * 70)
print("\nKey Takeaways:")
print("  1. Crossover detection requires at least 3 points per track")
print("  2. The predicate parameter controls the search distance threshold")
print(
    "  3. Different geodesic strategies offer accuracy/performance trade-offs"
)
print("  4. allow_multiple=True finds all crossovers, not just the first")
print("  5. Swath calculation helps visualize satellite sensor coverage")
print("\nBest Practices:")
print("  - Use VINCENTY or KARNEY for high-accuracy applications")
print("  - Set predicate based on your orbit accuracy requirements")
print("  - Consider track direction when interpreting crossovers")
print("  - Validate crossover locations against known ground truth")
print("  - Account for temporal separation in altimetry applications")
print("=" * 70)
======================================================================
SUMMARY: Satellite Geometric Operations
======================================================================

Key Takeaways:
  1. Crossover detection requires at least 3 points per track
  2. The predicate parameter controls the search distance threshold
  3. Different geodesic strategies offer accuracy/performance trade-offs
  4. allow_multiple=True finds all crossovers, not just the first
  5. Swath calculation helps visualize satellite sensor coverage

Best Practices:
  - Use VINCENTY or KARNEY for high-accuracy applications
  - Set predicate based on your orbit accuracy requirements
  - Consider track direction when interpreting crossovers
  - Validate crossover locations against known ground truth
  - Account for temporal separation in altimetry applications
======================================================================
Total running time of the script: (0 minutes 13.448 seconds)