The rise of the Python ecosystem for Data Processing
2026
Numpy
- Manipulate N-dimensional arrays
- Numerical computing tools :
- math functions
- linear algebra
- Fourier transform
- random number capabilities
- etc
- Performant: core is well-optimized C/C++ and Fortran code
- Easy and de facto standard syntax
Nearly every scientist working in Python draws on the power of NumPy

# The standard way to import NumPy:
import numpy as np

# Create a 2-D array, set every second element in
# some rows and find max per row:

x = np.arange(15, dtype=np.int64).reshape(3, 5)
x[1:, ::2] = -99
x
array([[  0,   1,   2,   3,   4],
       [-99,   6, -99,   8, -99],
       [-99,  11, -99,  13, -99]])
x.max(axis=1)
array([ 4,  8, 13])

# Generate normally distributed random numbers:
rng = np.random.default_rng()
samples = rng.normal(size=2500)
Scipy
![]()
- Use Numpy arrays as basic data structure
- Offer scientific functions :
- Optimization
- Interpolation
- Signal processing
- Linear algebra
- Statistics
- Image processing
import numpy as np
from scipy import linalg
import matplotlib.pyplot as plt
rng = np.random.default_rng()
xi = 0.1*np.arange(1,11)
yi = 5.0*np.exp(-xi) + 2.0*xi
zi = yi + 0.05 * np.max(yi) * rng.standard_normal(len(yi))
A = np.concatenate((np.exp(-xi)[:, np.newaxis], xi[:, np.newaxis]),axis=1)
c, resid, rank, sigma = linalg.lstsq(A, zi)
xi2 = np.arange(0.1,1.01,0.01)
yi2 = c[0]*np.exp(-xi2) + c[1]*xi2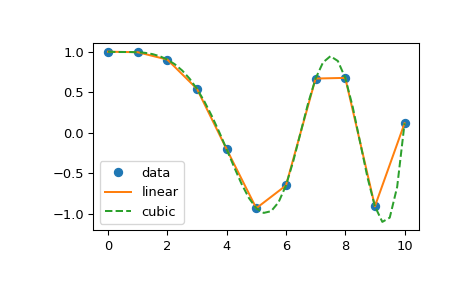
Pandas
- Deal with Dataseries and Dataframes (e.g. tables)
- Data manipulation and analysis
- Selection
- Grouping
- Merge
- Statistics
- Transformation
- Numerical tables and time series
- Extension to geospatial data with geopandas


import pandas as pd
pd.read_csv('Myfile.csv')
pd.describe()
Xarray
![]()
- Manipulate N-dimensional labelled arrays and datasets
- Introduce dimensions, coordinates and attributes on top of Numpy
- Borrows heavily from Pandas

Landscape
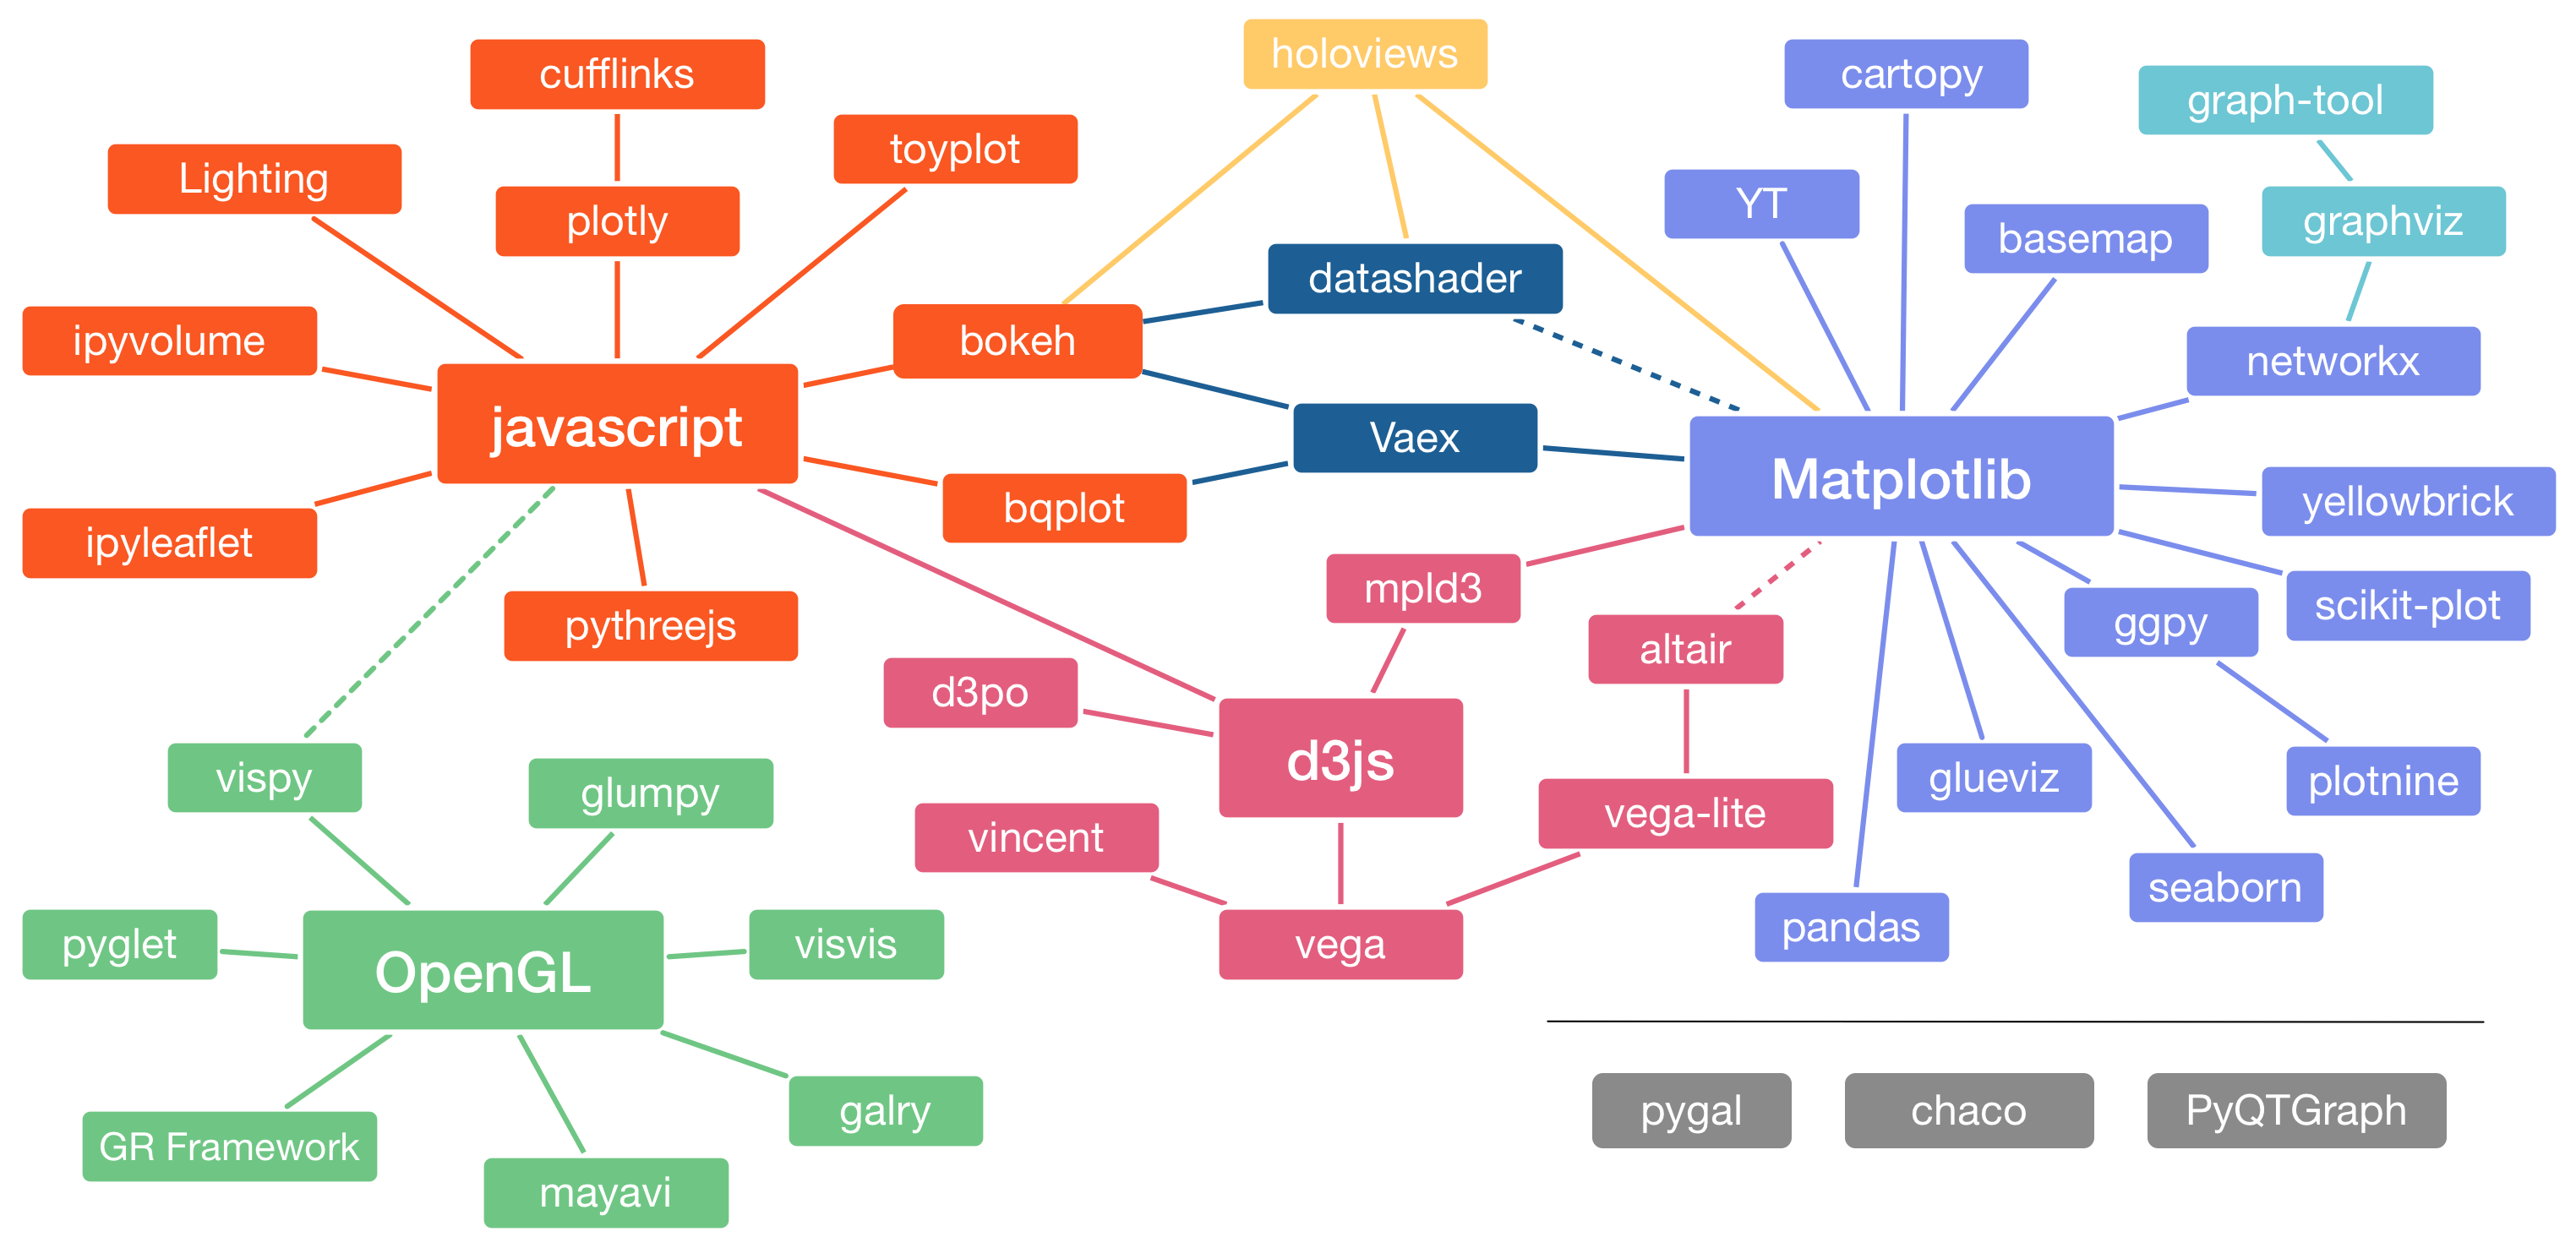
Matplotlib
- Base/Reference plotting library
- For Python and Numpy
- Static, animated, and interactive visualizations
- Designed to be as usable as MATLAB
fig, ax = plt.subplots(subplot_kw={"projection": "3d"})

# Plot the surface.
surf = ax.plot_surface(X, Y, Z, cmap=cm.coolwarm,
                       linewidth=0, antialiased=False)

# Customize the z axis.
ax.set_zlim(-1.01, 1.01)
ax.zaxis.set_major_locator(LinearLocator(10))
# A StrMethodFormatter is used automatically
ax.zaxis.set_major_formatter('{x:.02f}')

# Add a color bar which maps values to colors.
fig.colorbar(surf, shrink=0.5, aspect=5)

plt.show()![]()

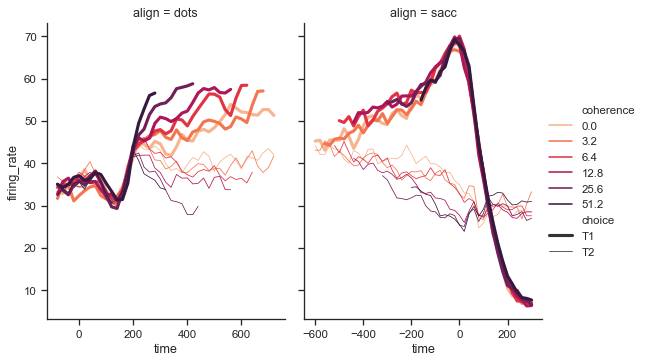
Seaborn
![]()
- Based on Matplotlib
- Integrates closely with Pandas
- Dataset oriented to produce informative plots
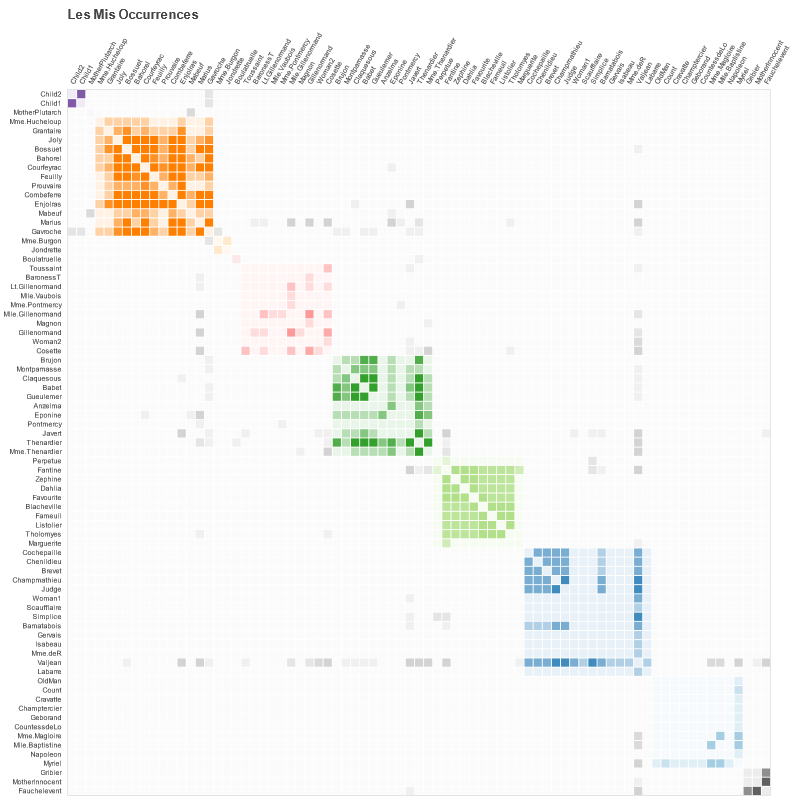
Plotly
![]()
- Interactive, publication-quality graphs
- Make dashboard with Dash

Bokeh

- Interactive, publication-quality graphs
- Make dashboard with Dash
Pyviz
![]()
- HoloViews: Declarative objects for instantly viewable data, building Bokeh plots from convenient high-level specifications
- GeoViews: Viewable geographic data that that can be mixed and matched with HoloViews objects
- Panel: Assembling objects from many different libraries into a layout or app, whether in a Jupyter notebook or in a standalone serveable dashboard
- Datashader: Rasterizing huge datasets quickly as fixed-size images
- hvPlot: Quickly return interactive HoloViews or GeoViews objects from your Pandas, Xarray, or other data structures
- Param: Declaring user-relevant parameters, making it simple to work with widgets inside and outside of a notebook context
Kaggle stats
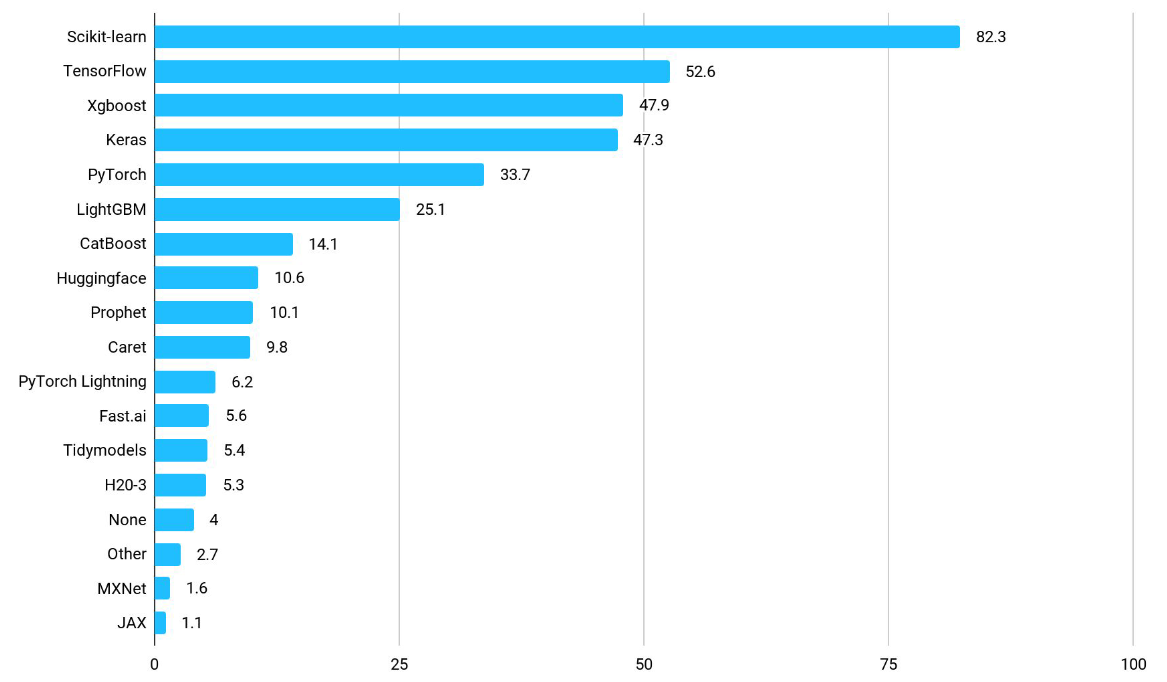
Sickit Learn
![]()
- Simple and efficient tools for predictive data analysis
- Built on NumPy, SciPy, and matplotlib
- Every classical ML Algorithms
- Standard interface with Pipelines, estimators, transformers
- No GPU support (so not good for Deep Learning)
from sklearn.ensemble import RandomForestClassifier
clf = RandomForestClassifier(random_state=0)
X = [[ 1,  2,  3],  # 2 samples, 3 features
     [11, 12, 13]]
y = [0, 1]  # classes of each sample
clf.fit(X, y)
Sickit Learn

Pytorch
![]()
- Deep Learning on GPU with no previous knowledge
- Additional libraries:
- pytorch-lightning
- pytorch3d
- tensorboard
- keras (>=3)
Gradient boosting algorithms
XGBoost
- Distributed gradient boosting library
- Efficient, flexible and portable
- XGBoost provides a parallel tree boosting
- Runs on major distributed environment (Hadoop, SGE, MPI, Spark)
- Solve problems beyond billions of examples
![]()
LighGBM
- Distributed gradient boosting framework
- Efficient, Faster, lower memory usage, better accuracy
- Support of parallel, distributed, and GPU learning
- Capable of handling large-scale data
![]()
Data Version Control

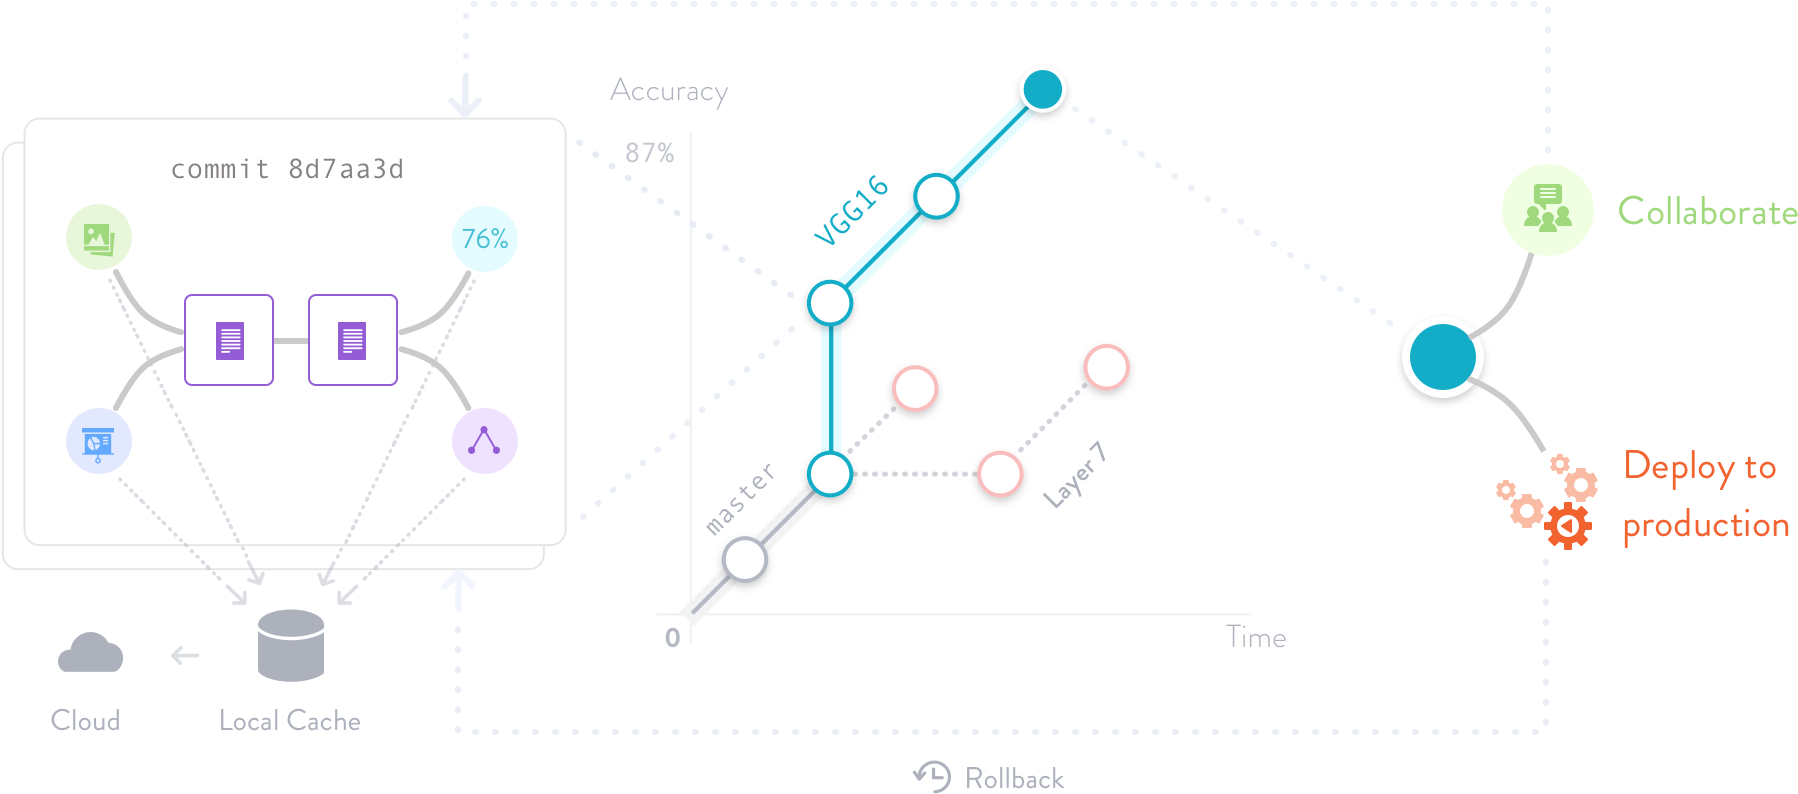
- Version your data and models: Store them in your cloud storage but keep their version info in your Git repo.
- Track experiments in your local Git repo (no servers needed).
- Share experiments and automatically reproduce anyone’s experiment.
MLFlow
![]()
- Tracking experiments to record and compare parameters and results (MLflow Tracking).
- Packaging ML code in a reusable, reproducible form in order to share with other data scientists or transfer to production (MLflow Projects).
- Managing and deploying models from a variety of ML libraries to a variety of model serving and inference platforms (MLflow Models).
- Providing a central model store to collaboratively manage the full lifecycle of an MLflow Model, including model versioning, stage transitions, and annotations (MLflow Model Registry).
MLFlow
![]()
Sympy
![]()
- Library for symbolic mathematics
- Simplification, Calculus, Solvers
from sympy import symbols
x, y = symbols('x y')
expr = x + 2*y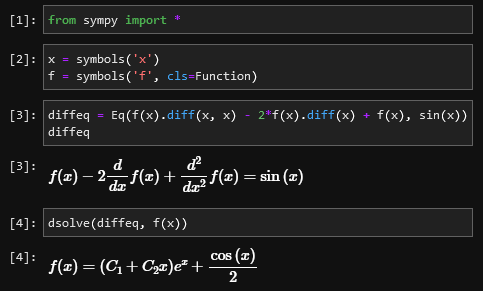
Shapely
- Library for manipulation and analysis of planar geometric objects
import shapely
import numpy as np

geoms = np.array([Point(0, 0), Point(1, 1), Point(2, 2)])
polygon = shapely.box(0, 0, 2, 2)

shapely.contains(polygon, geoms)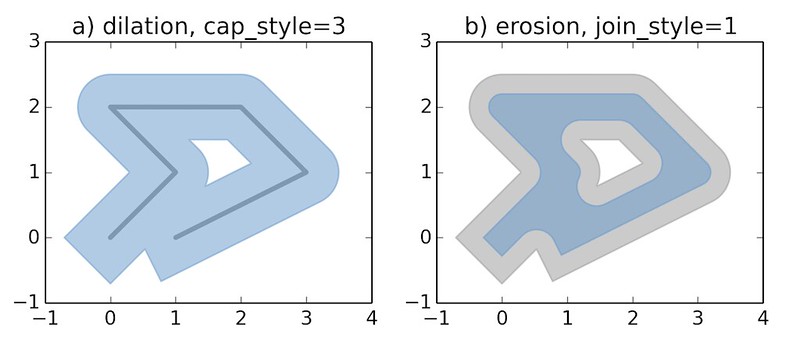
Pandas Extension
GeoPandas
- For manipulating geospatial data in python easier
- Provide geospatial operations in pandas:
- Measure areas and distances
- Compute intersections/unions
- Make maps and plots

Text Extensions for Pandas
- Add NLP-specific data types, operations, and library integrations to Pandas
- Make it easier to manipulate and analyze NLP-related data with Pandas
Jupyter (Lab and Notebook)

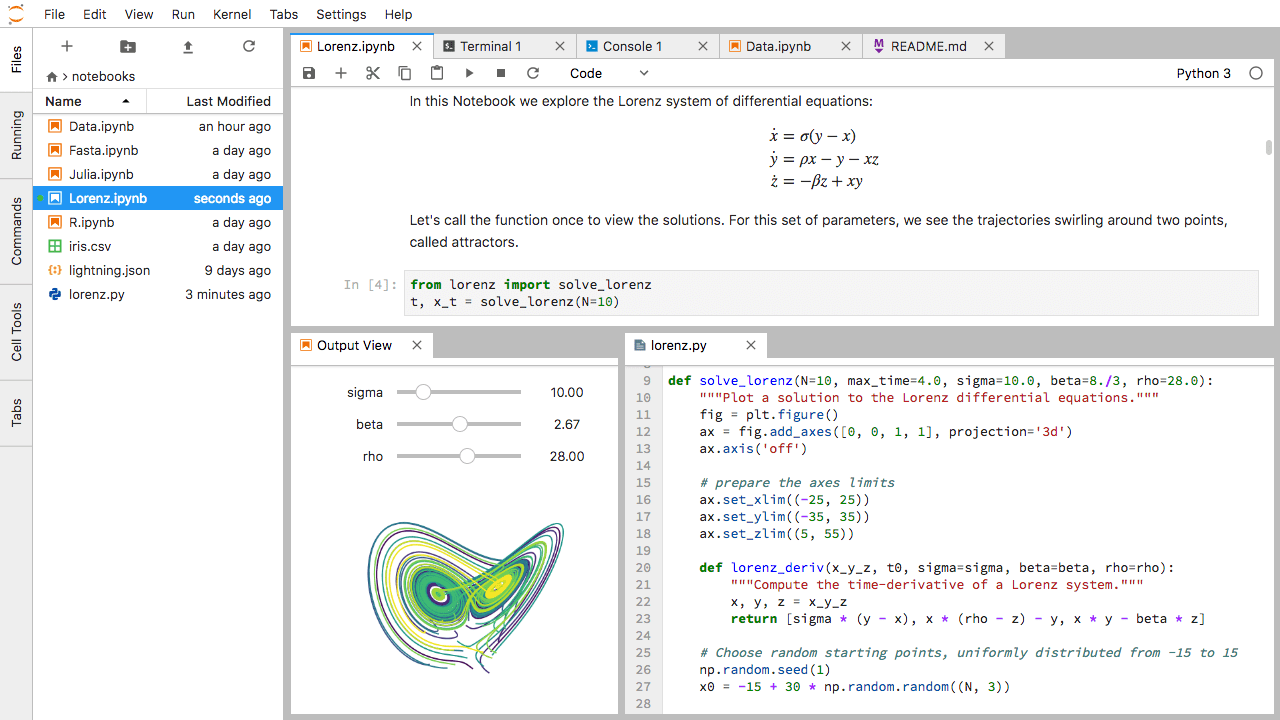
- Open source web application
- Create and share documents that contain live code
- Equations, visualizations and narrative text
- Interactive programming and visualizing
- Usage:
- data cleaning and transformation,
- numerical simulation,
- statistical modeling,
- data visualization,
- machine learning
- Used by Google Colab or Kaggle
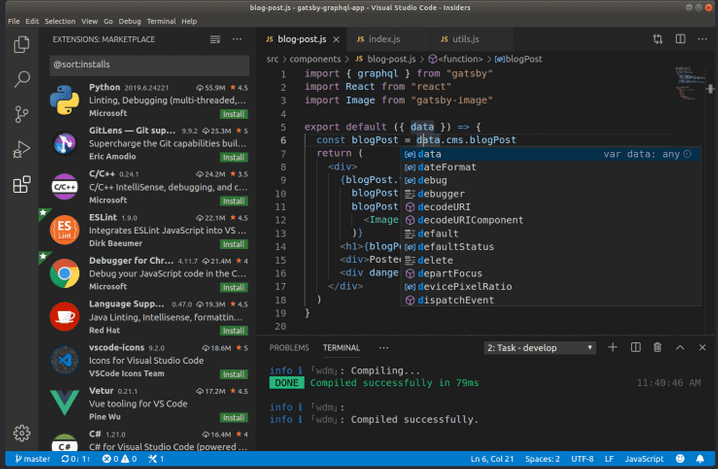
VSCode
![]()
- Source-code editor developed by Microsoft for Windows, Linux and macOS.
- Features include support for
- debugging,
- syntax highlighting,
- intelligent code completion,
- snippets,
- code refactoring,
- testing and
- embedded Git.
- Lots of extensions that add functionality.
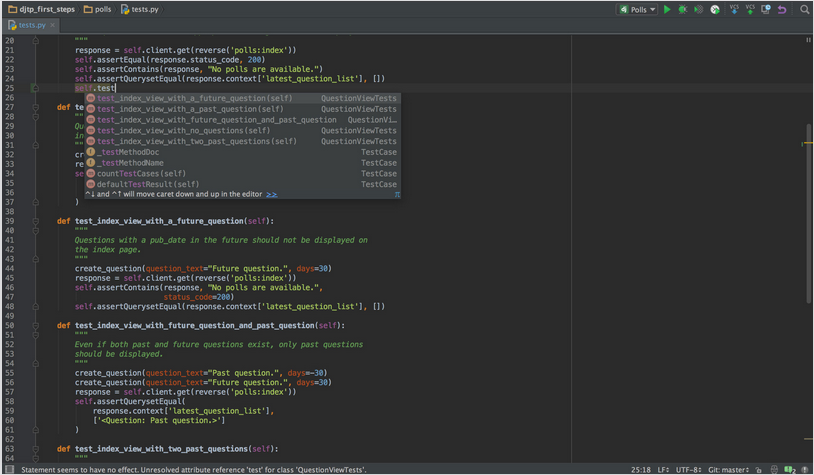
PyCharm
![]()
- IDE used for programming in Python
- Cross-platform, working on Microsoft Windows, macOS and Linux
- Features include support for
- Code analysis,
- Graphical debugger,
- Integrated unit tester,
- Integration with version control systems
Pip / Conda / Pixi

![]()
![]()
- Package libraries
- Make them available on repositories
- Build environments automatically
Packaging: Pip / Conda / Pixi
![]()
![]()
Difference between Conda and Pip according to Anaconda.
| conda / pixi | pip | |
|---|---|---|
| manages | binaries | wheel or source |
| can require compilers | no | yes |
| package types | any | Python-only |
| create environment | yes, built-in | no, requires virtualenv or venv |
| dependency checks | yes | no |